

Utilities are spending billions of dollars to build power plants, transmission lines, substations, and other infrastructure to support America’s data center buildout. Over the coming decade, they will spend many billions more. Some utilities are set to double or triple in size, due to data center demand alone.
But there’s no one place to see where all that demand will show up. Publicly traded utilities disclose their data center pipelines in SEC filings, but they often don’t break down those numbers by the stage of development. Utilities often announce deals with hyperscalers, but they don’t share the total amount of power that will be consumed or when it will ramp.
Today we’re excited to announce that Cleanview now shows the utility, balancing authority and grid operator for each data center we track.
What’s included
For each data center campus we track, we now show:
The utility that provides power, and its parent company (AEP Ohio and American Electric Power, for example)
The balancing authority that manages power supply and demand
The grid operator: PJM, ERCOT, MISO, SPP, CAISO, NYISO or ISO-NE, or “Non-ISO” for utilities that run their own grid, like Southern Company and TVA
EIA IDs for the utility and balancing authority
All of this data is available in our data platform, CSV exports, and API.
Examples of how you can use this data
Which utilities are seeing the most data center demand?
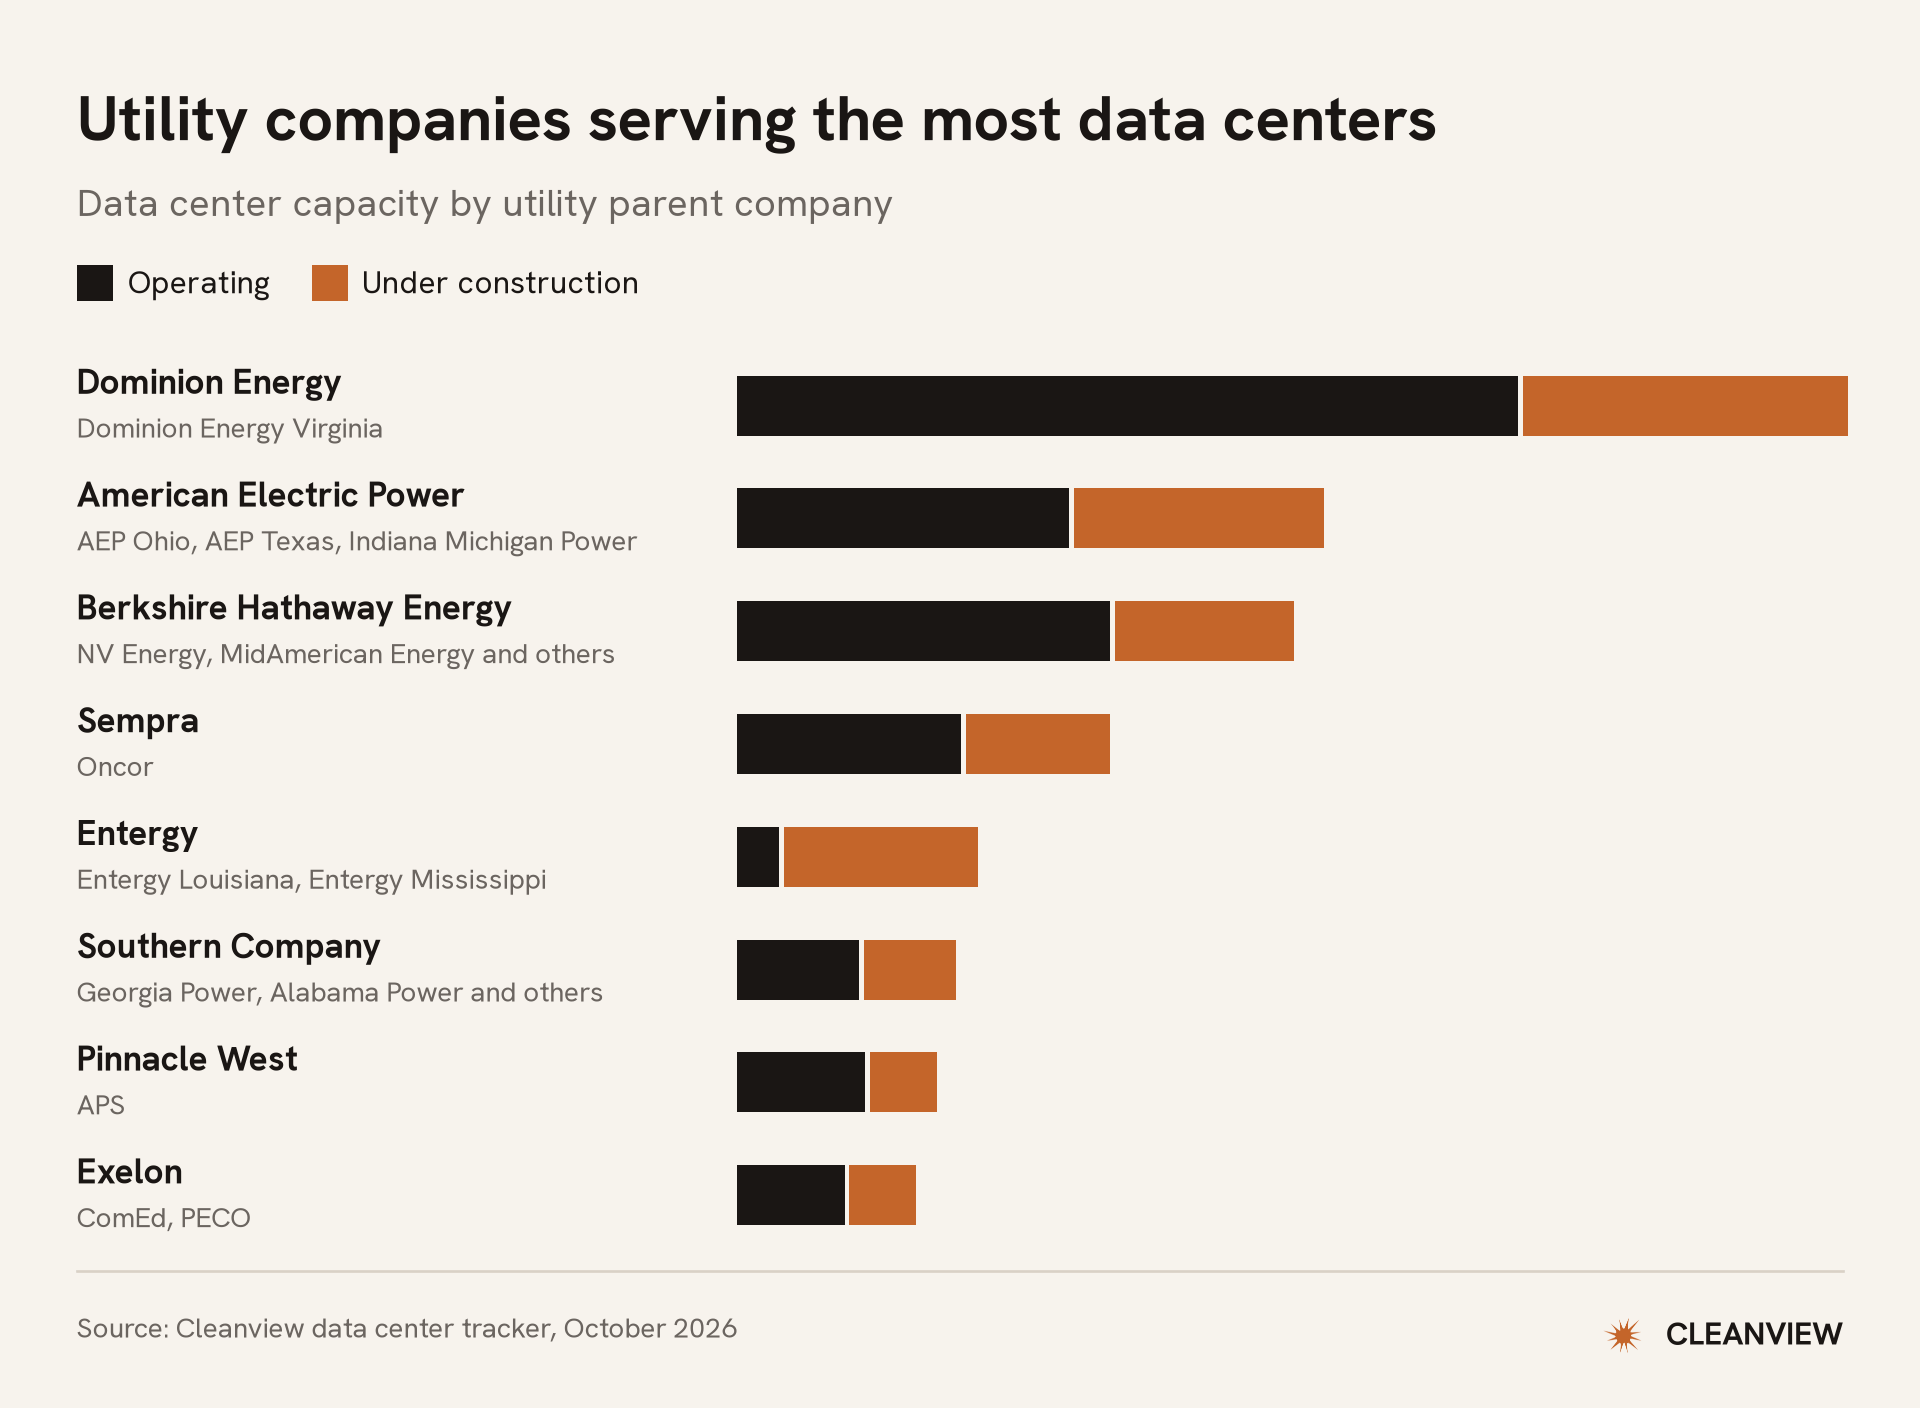
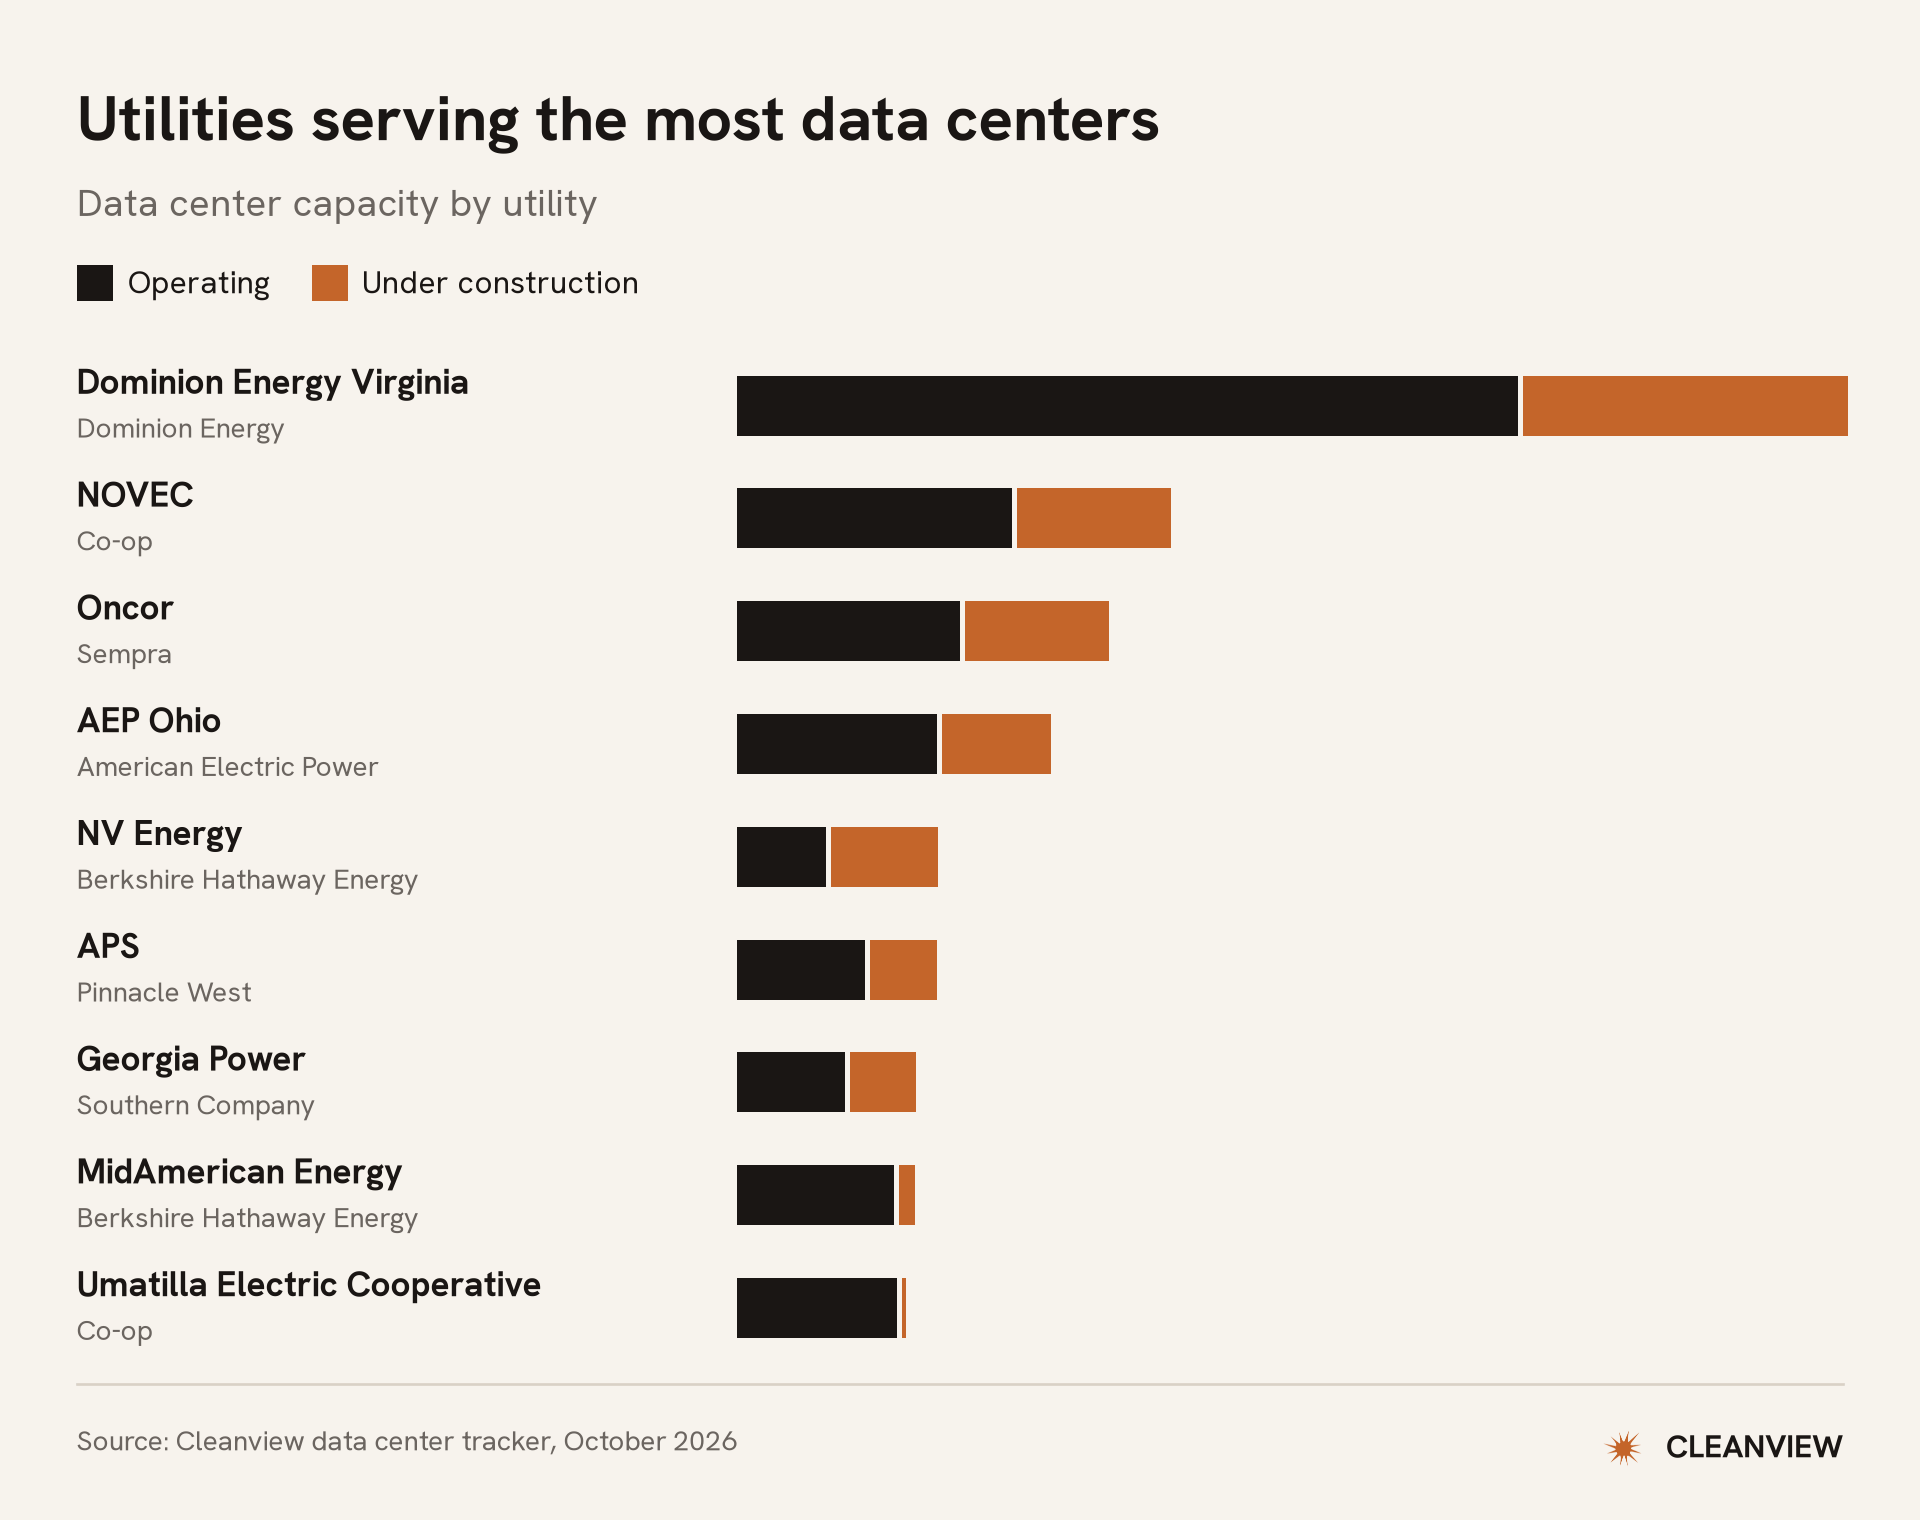
It’s well known that Dominion—the utility of choice in Data Center Alley—serves more data center power than any company on Earth. But utilities across the country are quickly catching up as hyperscalers have expanded across the US in search of power.
Which grids are keeping up?
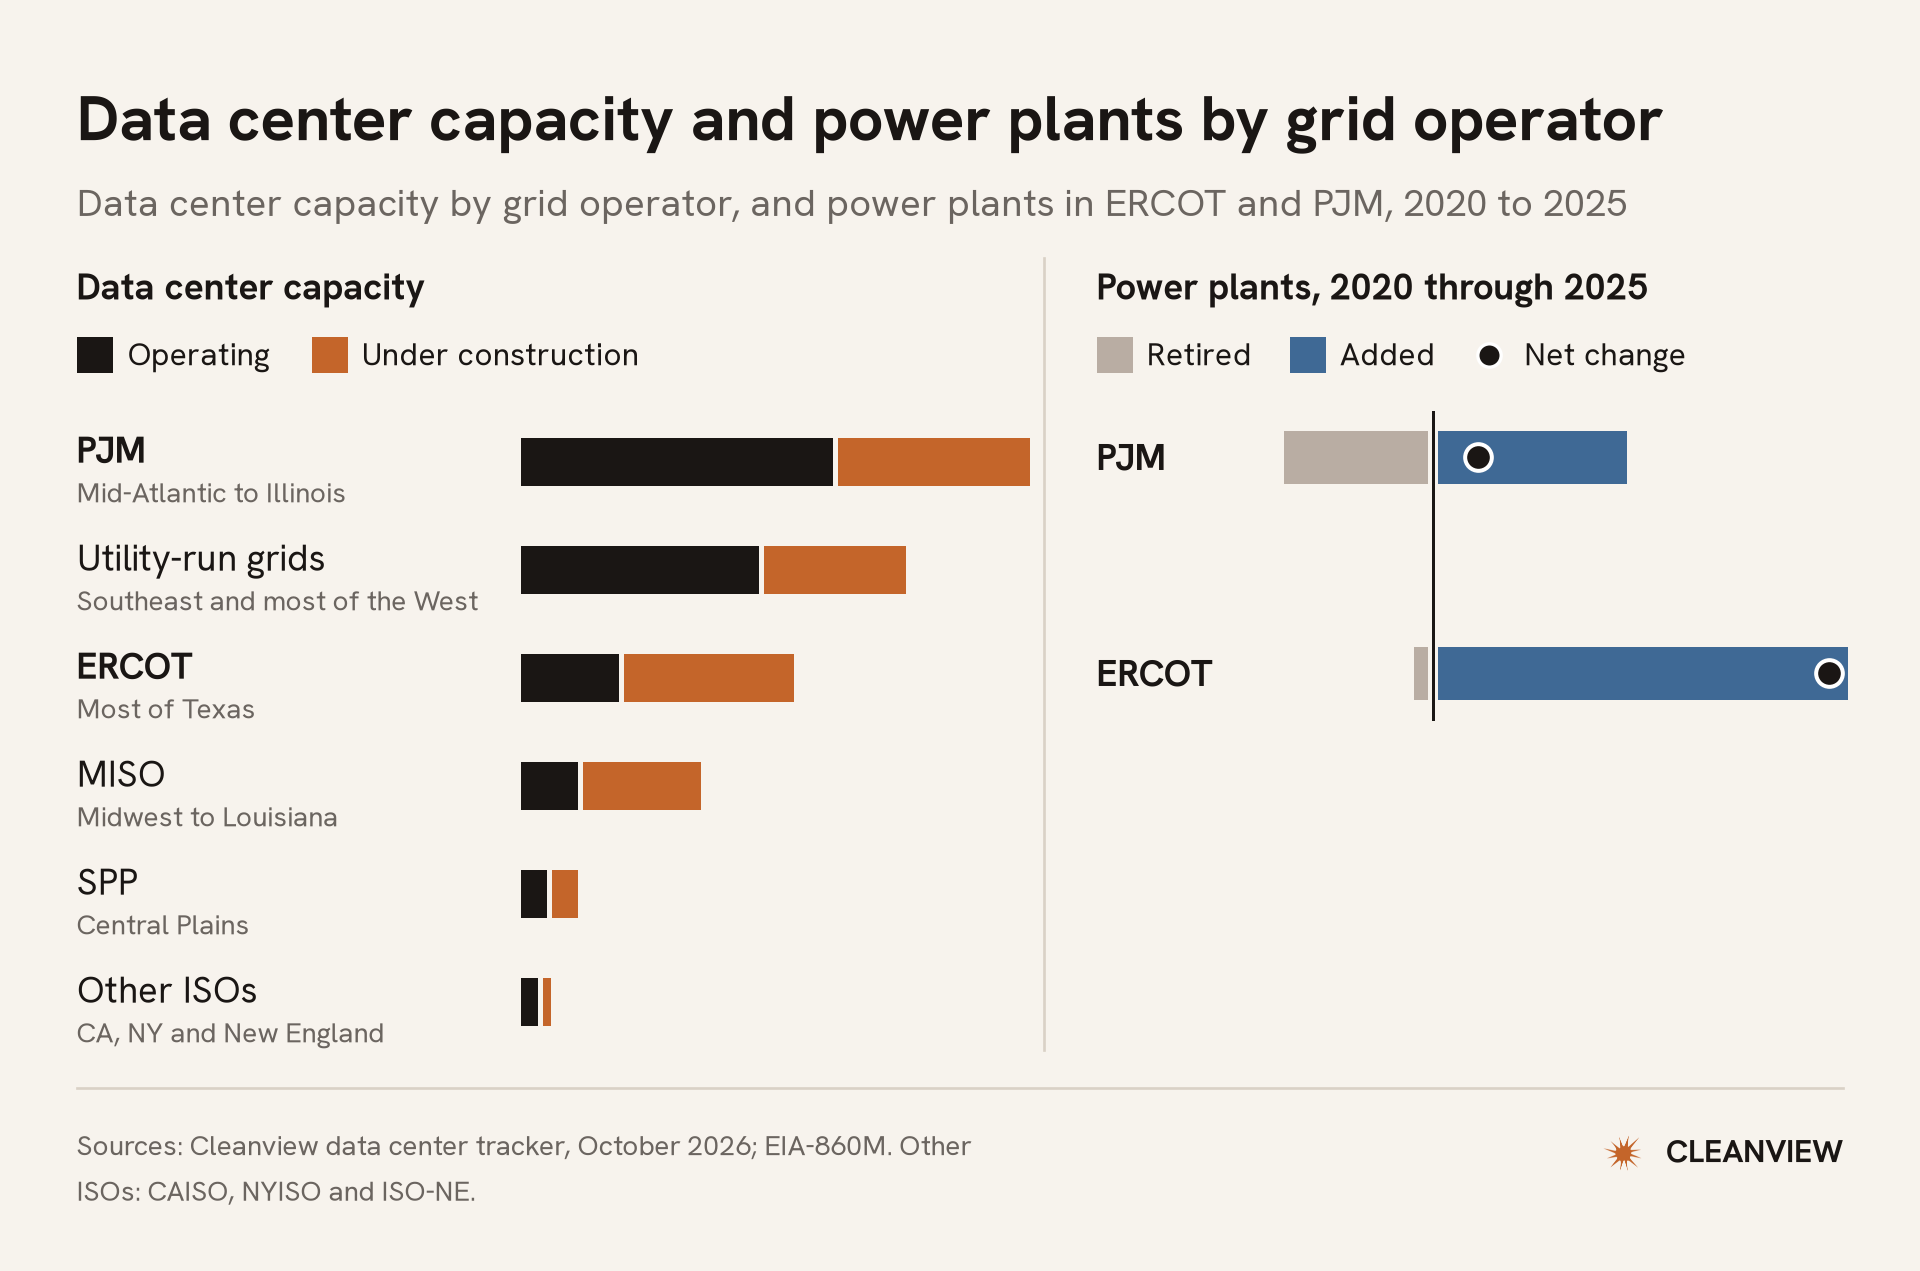
PJM and ERCOT have 55% of the data center capacity under construction in the US. In our recent report, The Geography of Compute, we compared how much power each grid has added to keep up.
From 2020 through 2025, ERCOT added 60 GW of power plants—mostly solar, wind and batteries—and retired 2 GW. PJM added 28 GW and retired 21 GW. That means that ERCOT’s power plant fleet grew by 58 GW, while PJM’s grew by about 7 GW.
Americans living in the PJM territory felt the difference in their power bills. In the first seven months of this year, residential electricity prices rose about 13% in Virginia and Ohio compared with the same months of 2025. In Texas, they rose 5.7%, according to EIA.
Chat with us to learn more
If you’re a Cleanview customer, the new fields are live now in the data center table. If you’d like to learn more about Cleanview’s data platform and API, send us a note.


