

Last month, Cleanview broke the news that Amazon is planning to build a 7.65 GW natural gas power plant in West Texas to power a data center campus. The next day that story was in The New York Times. By the weekend, it was making headlines around the world. The following Monday, Amazon issued an official statement about the project verifying everything that we published.
Identifying that project and linking it to Amazon only took a few hours of work. But that’s thanks to thousands of hours of work our team has spent building Cleanview over the last two and a half years.
Today, we’re excited to announce a series of updates to our data center tracker—many of which we used to identify Amazon’s West Texas data center and dozens of projects since then.
Building-level coverage
Earlier this summer, we began tracking data centers at building-level resolution. This offers much more detailed analysis on both individual campuses and the broader data center buildout.
Take Meta’s Prometheus data center in New Albany, Ohio, as an example. The company brought five data center buildings online between 2020 and 2023. But then the company threw its cloud-era data center playbook out the window and began building new AI-optimized buildings (seen on the right of the image below). Even more recently, the company began building tents powered by off-grid gas turbines on the south part of the campus.
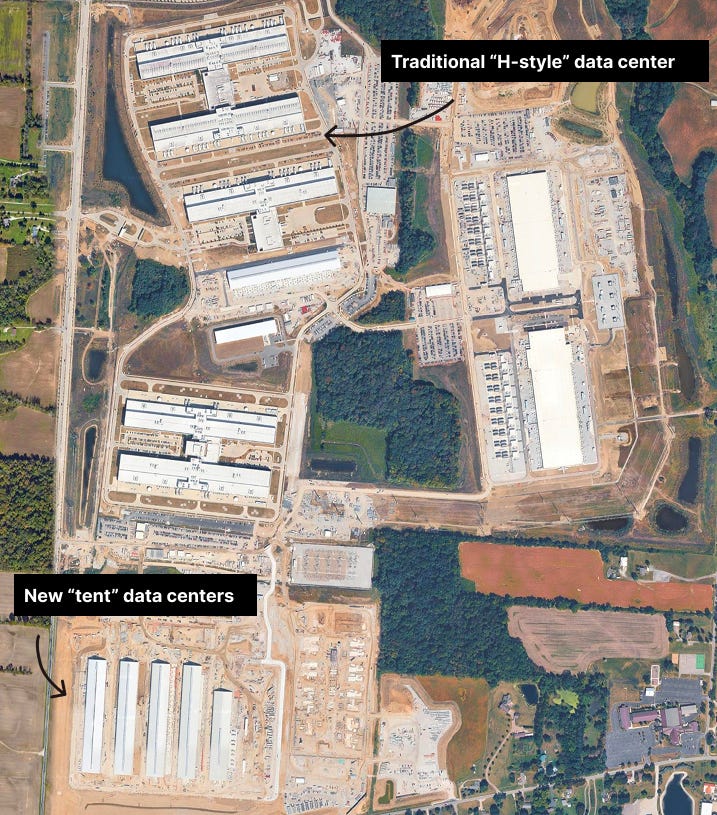
On a single campus, Meta has three different data center designs that use two different power strategies. The buildings came online at different times. Building-level coverage lets us see all of this and analyze what it means—for the grid, the economy, and the environment.
Using satellites to verify construction status
When we identify a new data center, we often review dozens of different documents—everything from building permits to utility filings. In the last year alone, our team has reviewed tens of thousands of documents. But there’s only so much you can learn from public records.
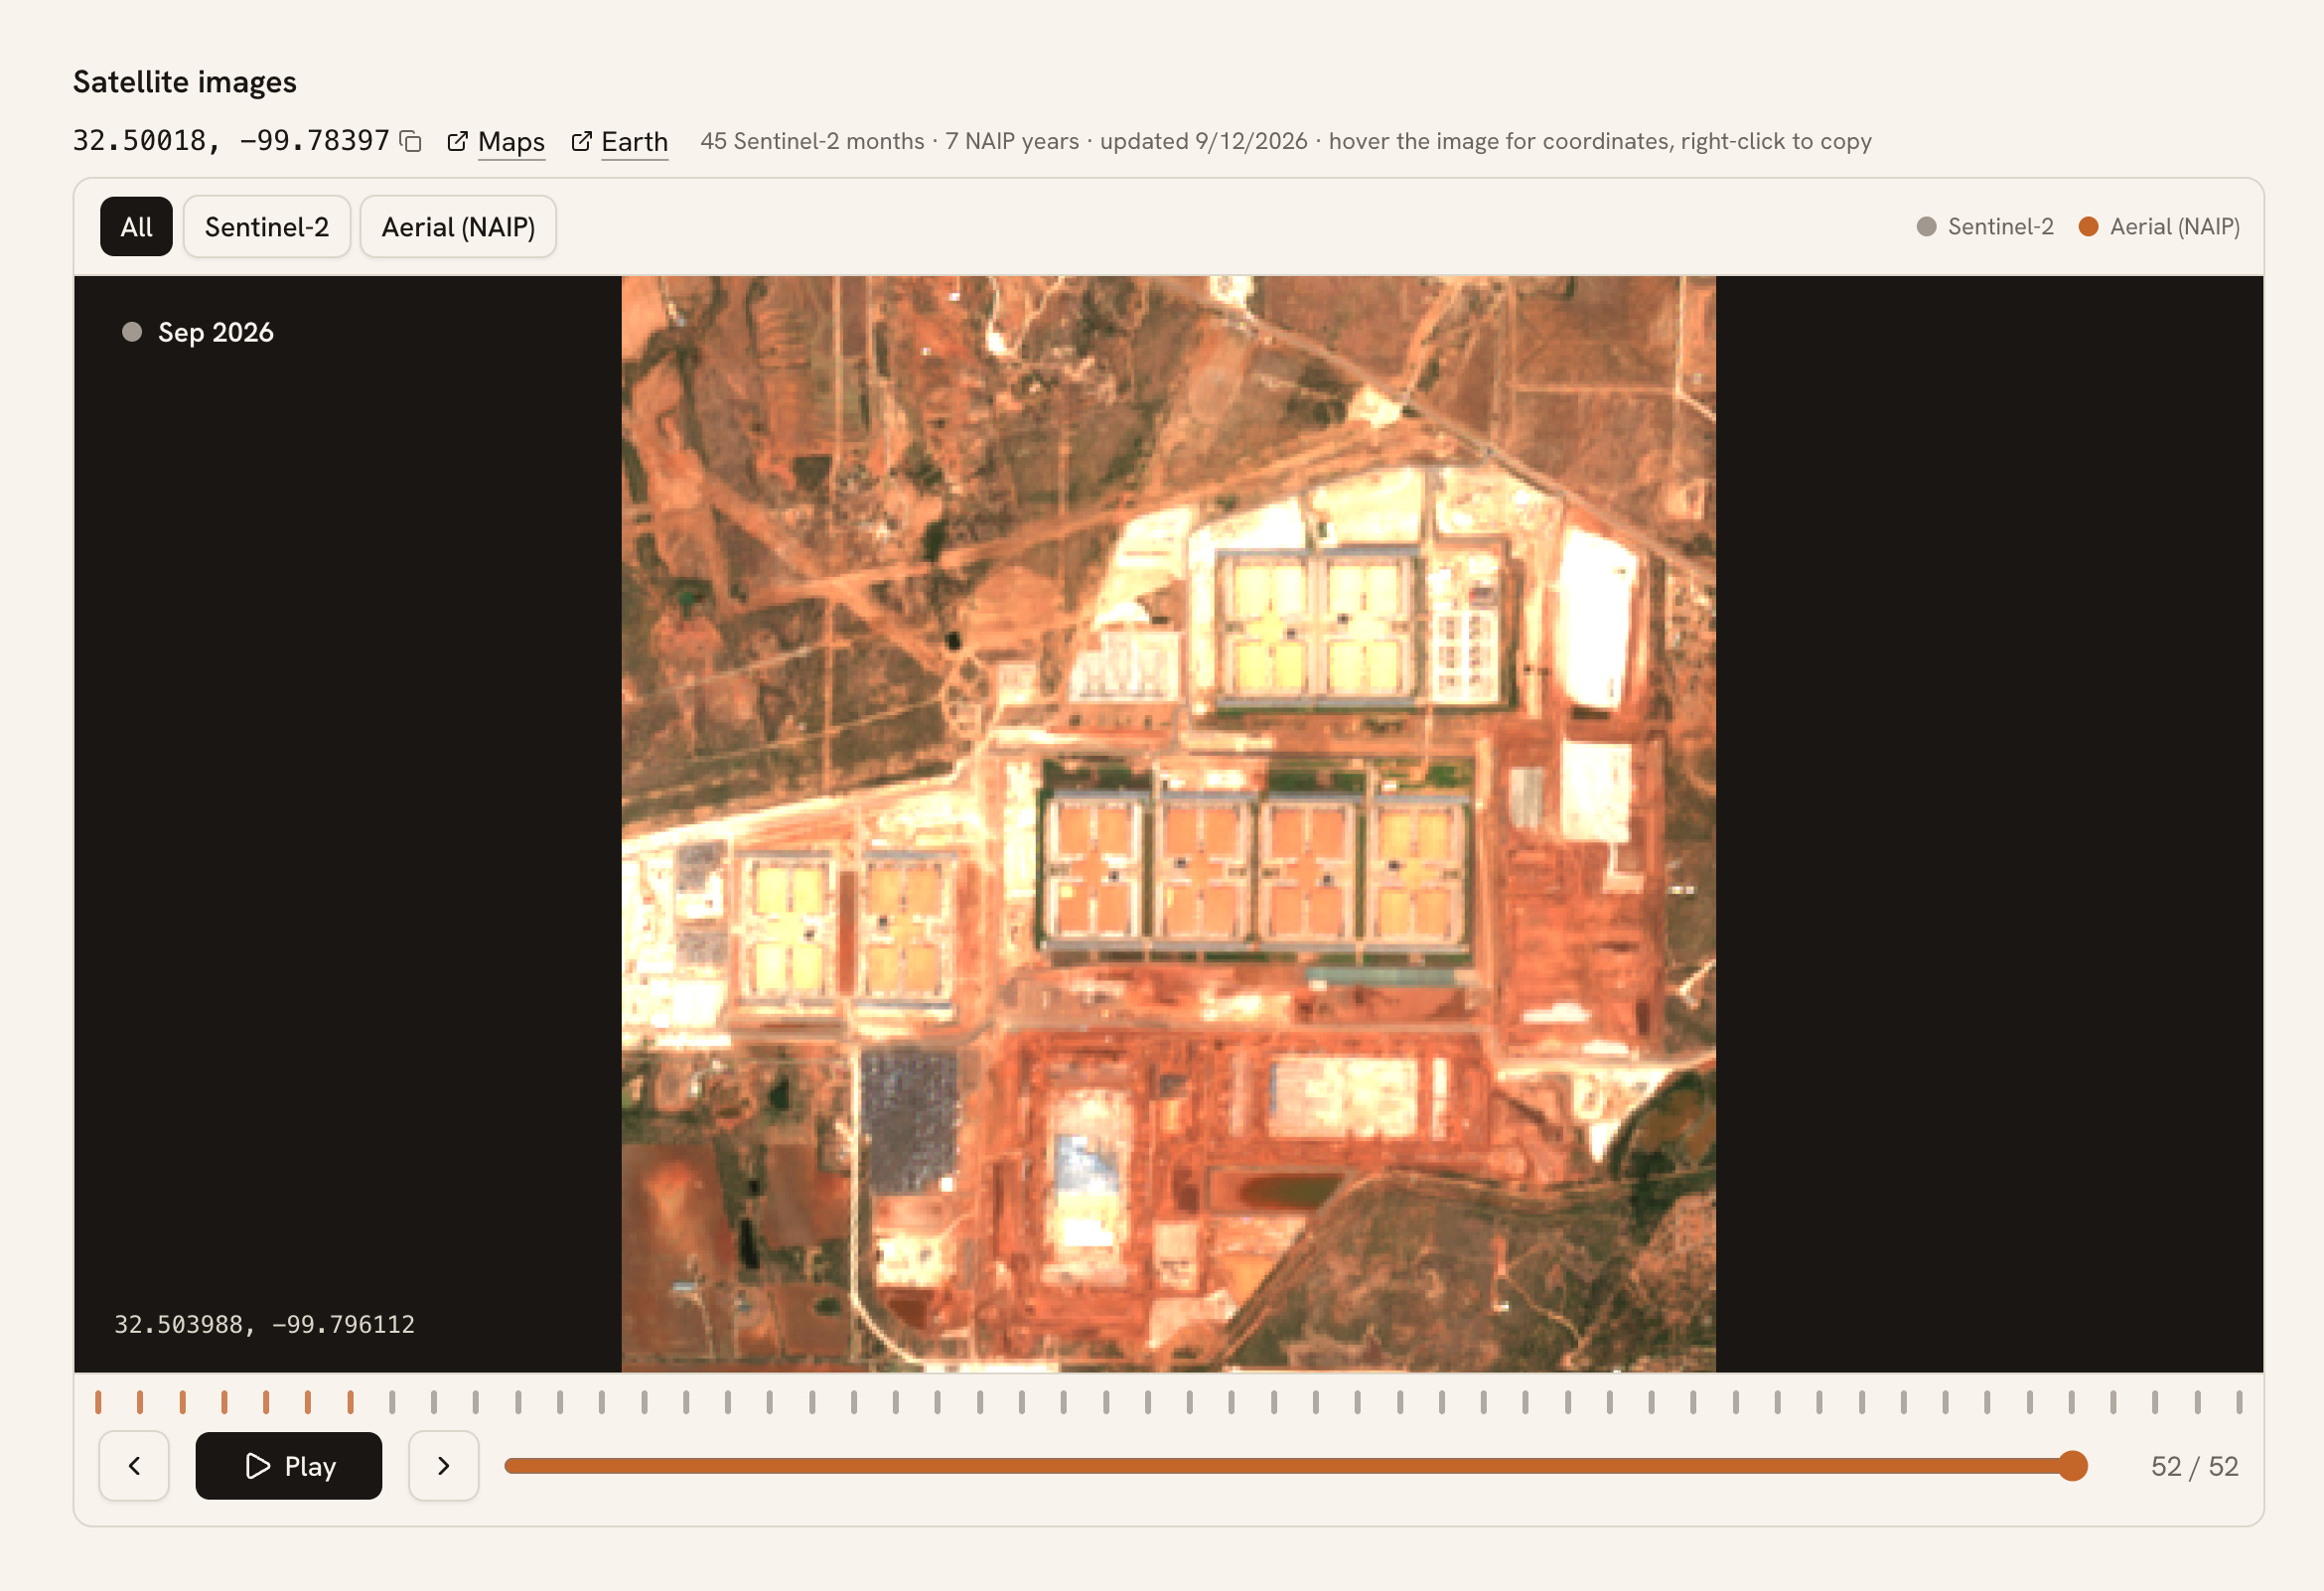
In April of this year, we learned this firsthand when we investigated Fermi America’s Project Matador data center. At the time, the company’s website said that Fermi’s team had completed the first stage of construction. But when we reviewed satellite images of the data center, we found that the company hadn’t begun vertical construction on any of its data center buildings. When we compared satellite images month over month, we discovered the company wasn’t making any progress at all.
We published our story, which led to coverage in Axios, The Washington Post, and multiple other media outlets.
Behind the scenes, we’ve built internal tools that pull in dozens of satellite images per campus and give our researchers an easy way to check the status of projects.
Tracking facility power and IT capacity
When it comes to tracking the data center buildout, you’ll often hear about megawatts and gigawatts. But not all megawatts are the same.
Many companies report and talk about their “IT capacity,” which is how much power their chips and servers use. This is useful when benchmarking how much revenue a company makes per MW of capacity, for example.
Other companies report and talk about “total facility power,” which includes IT capacity and all the overhead power that goes to things like cooling and lighting. If you want to understand the impact of a data center on the grid or the environment, this is the number you care about.
Cleanview measures both. And we have remarkably high coverage rates and accuracy thanks to our updated methodology.
Chat with us to learn more
If you can’t tell, we’re really excited about all of these updates and what they enable. If you’re interested in learning more about Cleanview’s platform, we’d love to chat. You can reach out to our team using the button below.