

Earlier this month, voters across the United States elected politicians who promised to slow down the data center boom. But in the quarter before the election, construction already slowed down.
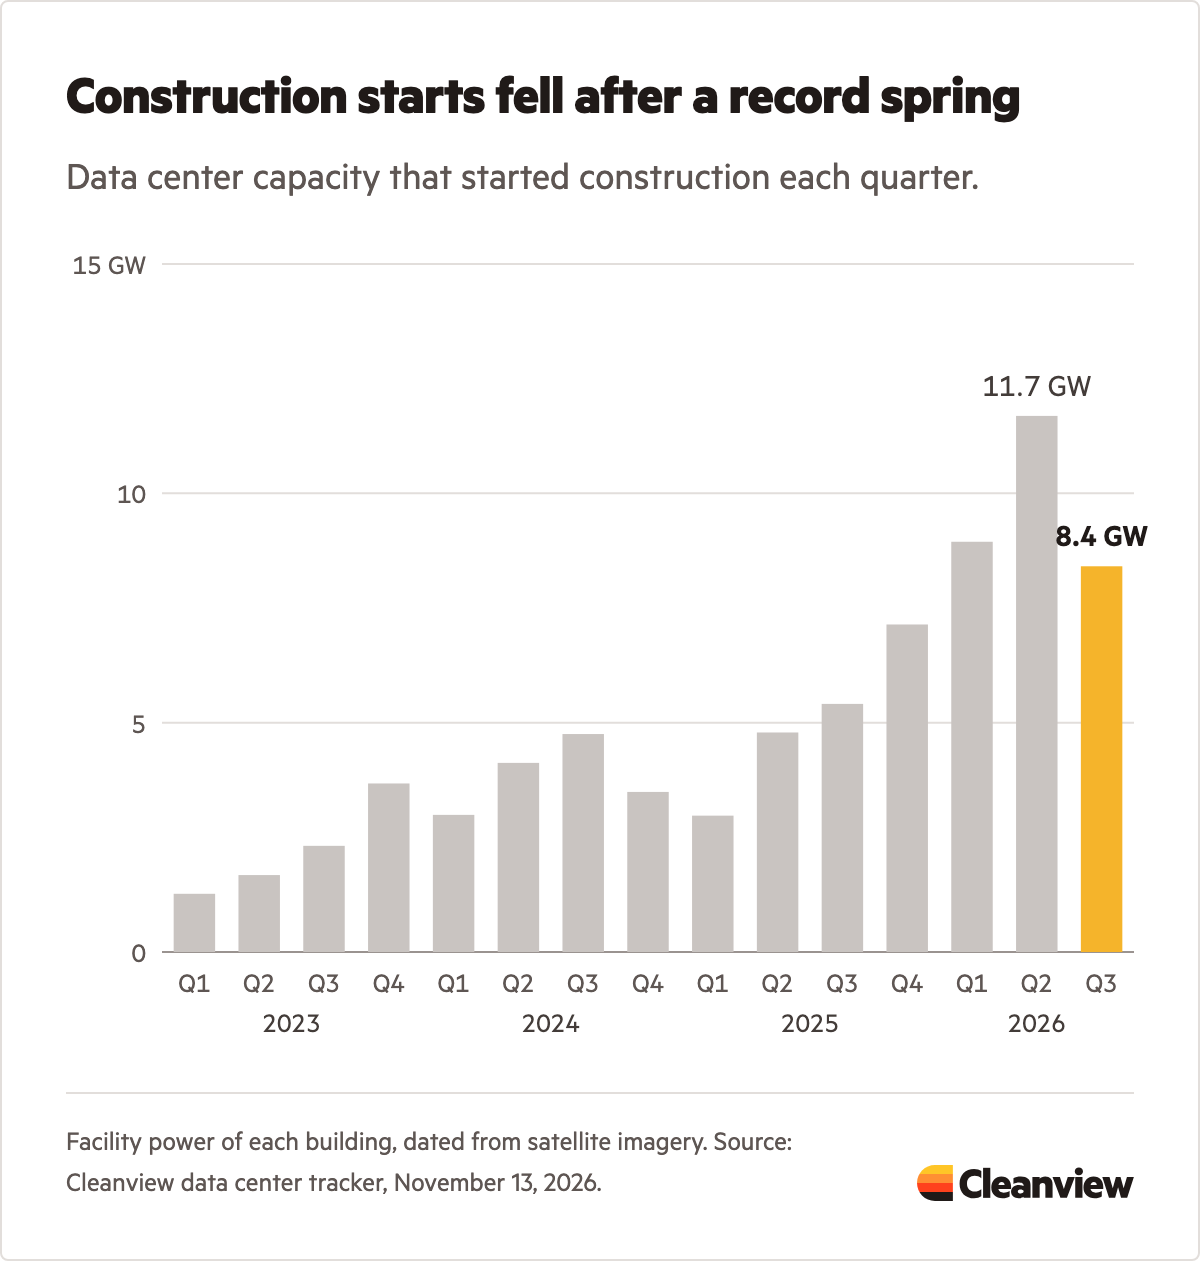
Over the last few months, Cleanview’s team has analyzed thousands of satellite images to understand the pace and trajectory of America’s AI infrastructure buildout. We learned that from July through September, developers began construction on 8.4 GW of data center capacity, down 28% from a record 11.7 GW in the spring.
Whether or not the slowdown will last is of huge consequence—not just for the tech industry or the United States, but for the global economy too. Developers have started construction this year on data centers that will cost about $1 trillion to build and equip, according to our estimates. A lasting slowdown would reach the utilities planning new power plants, the companies making chips and turbines, and a stock market that has bet heavily on AI.
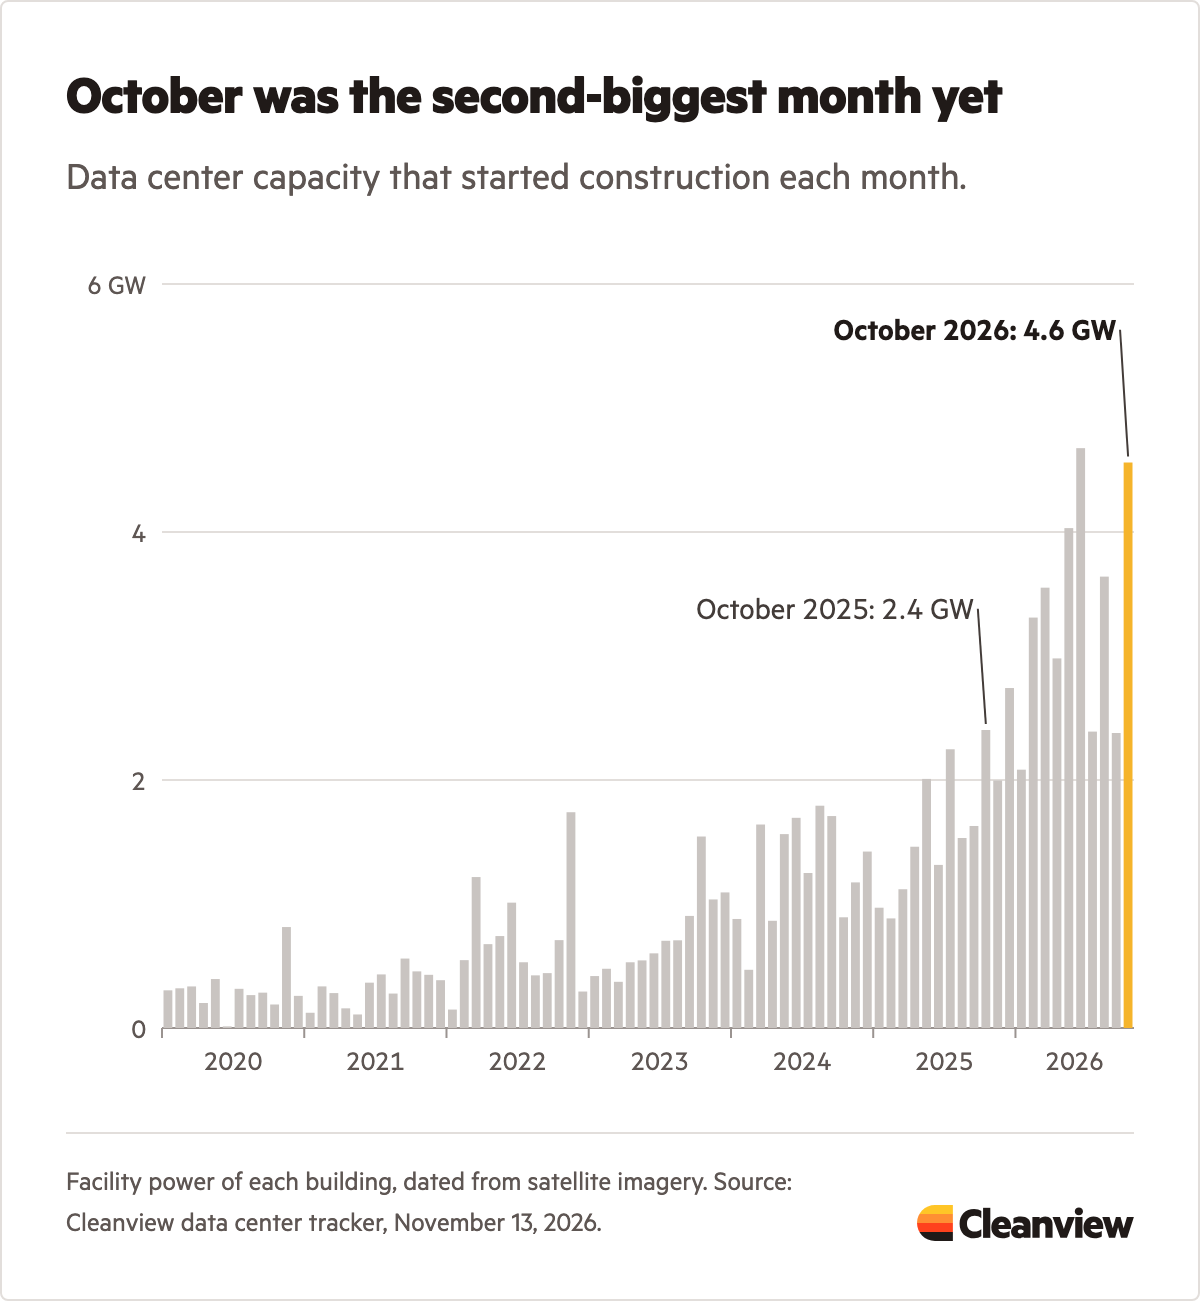
It’s too early to call it a trend though. In October, the last month before the election, construction picked back up. It was the second-biggest month for construction starts on record. If construction activity in November and December looks anything like October, then the fourth quarter would end at a new record.
These numbers come from a new dataset we launched today in the Cleanview platform that tracks the construction timelines of more than a thousand data centers across the US.
Given the implications of this data, we’ve decided to publish a free analysis with some of the top-line numbers that we plan to update regularly. You can read the first edition here.
In today’s newsletter, we’ll share a few takeaways from that analysis.
Construction slowed in Q3 after a record spring
In the last year, the pace of new data center construction has more than doubled. Between the second quarter of 2025 and 2026, developers went from starting about 5 GW of new data center capacity to almost 12 GW.
But in the third quarter, things slowed down: Developers started 8.4 GW across 65 buildings. That's still the third-biggest quarter on record, and 55% more than the same quarter last year. But it’s down from the 11.7 GW across 96 buildings started in the second quarter.
Capacity under construction has doubled in the last year
It’s hard to overstate how much data center capacity is currently under construction.
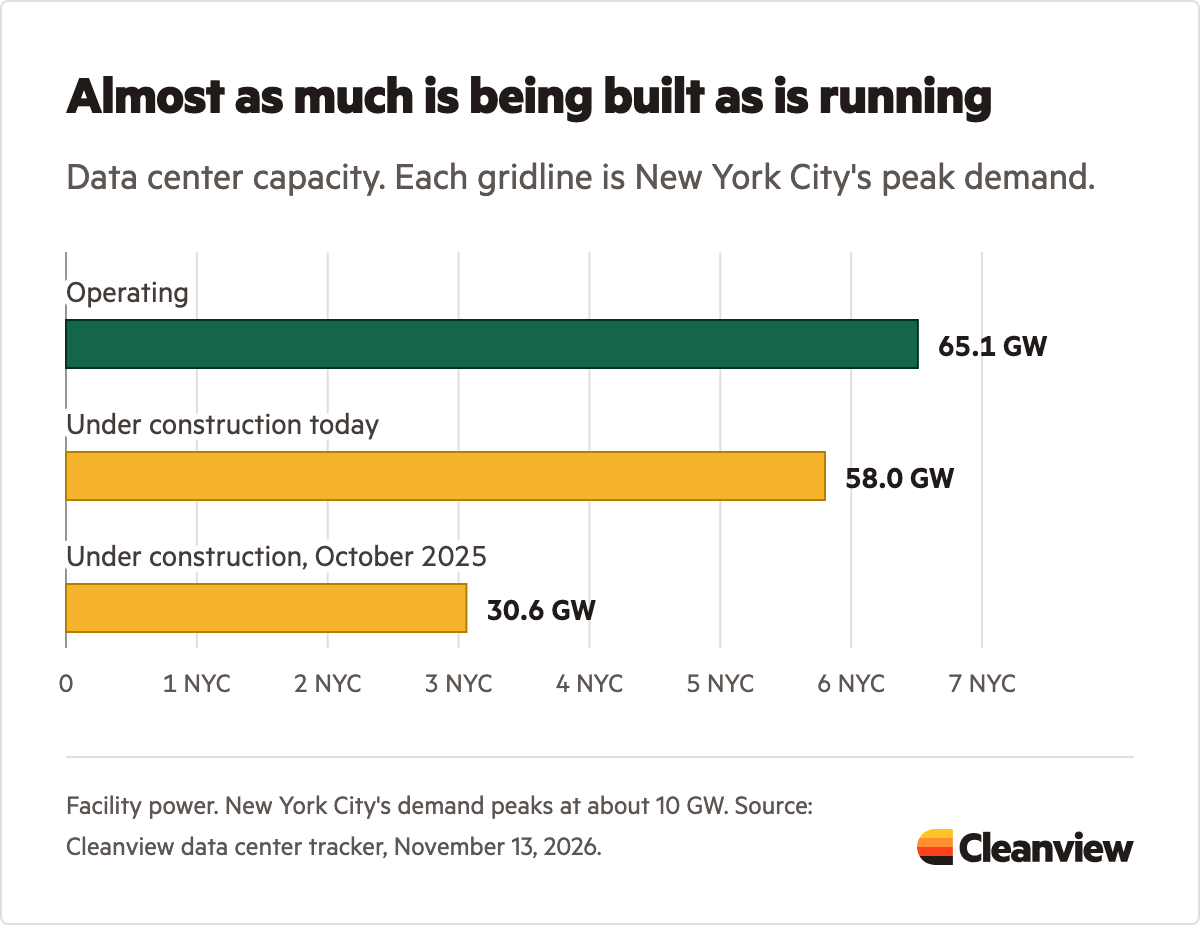
Developers started 38 GW of data center capacity in the last 12 months, twice as much as the 12 months before. Today 58 GW is under construction, nearly as much as the 65 GW already operating.
To put that in context, consider that New York City’s power demand peaks at about 10 GW. That means the data centers under construction will use as much power as almost six New York Cities.
If the AI infrastructure buildout were to plateau, it would be problematic for a stock market that has assumed continued growth. But it would plateau at a high level compared to the recent past. Adding 10 GW per quarter would be equivalent to all the capacity of the initial OpenAI Stargate initiative.
October picked back up
The slowdown last quarter could be a short-term blip. Developers started 4.6 GW in October (the first month in Q4 for those of you who don’t think in Wall Street earnings calendar time). That’s nearly double October 2025.
A few very large buildings contributed to October’s growth:
Nscale’s Monarch campus in West Virginia for Anthropic: 720 MW
Related Digital’s Stargate Michigan campus, for Oracle and OpenAI: 461 MW
Crusoe’s Abilene campus in Texas, for Microsoft: 450 MW
One month doesn’t make a trend. But if November and December match October, the fourth quarter will set a new record at about 14 GW.
What comes next
Nine states now have a governor or governor-elect who has promised or already imposed a pause. Those states hold 41% of the planned data center capacity in the US, according to our analysis.
Most of those pledges will impact projects that haven’t started construction yet. That means one of the first places to see their impact will be in the monthly construction start data.
Over the coming months and quarters we’re planning to watch the trend closely and share what we learn here and with our customers.
Learn more about our newest dataset
Today there are few reliable ways to tell whether the data center boom is speeding up or slowing down. Companies announce far more than they build. Permits show what a developer plans, but not what actually gets built. And a data center that comes online today was a decision made two years ago.
That’s why we spent so much time building our monthly construction tracking feature. Every month, our analysts look at new satellite images of all data center campuses across the US and record when construction begins.
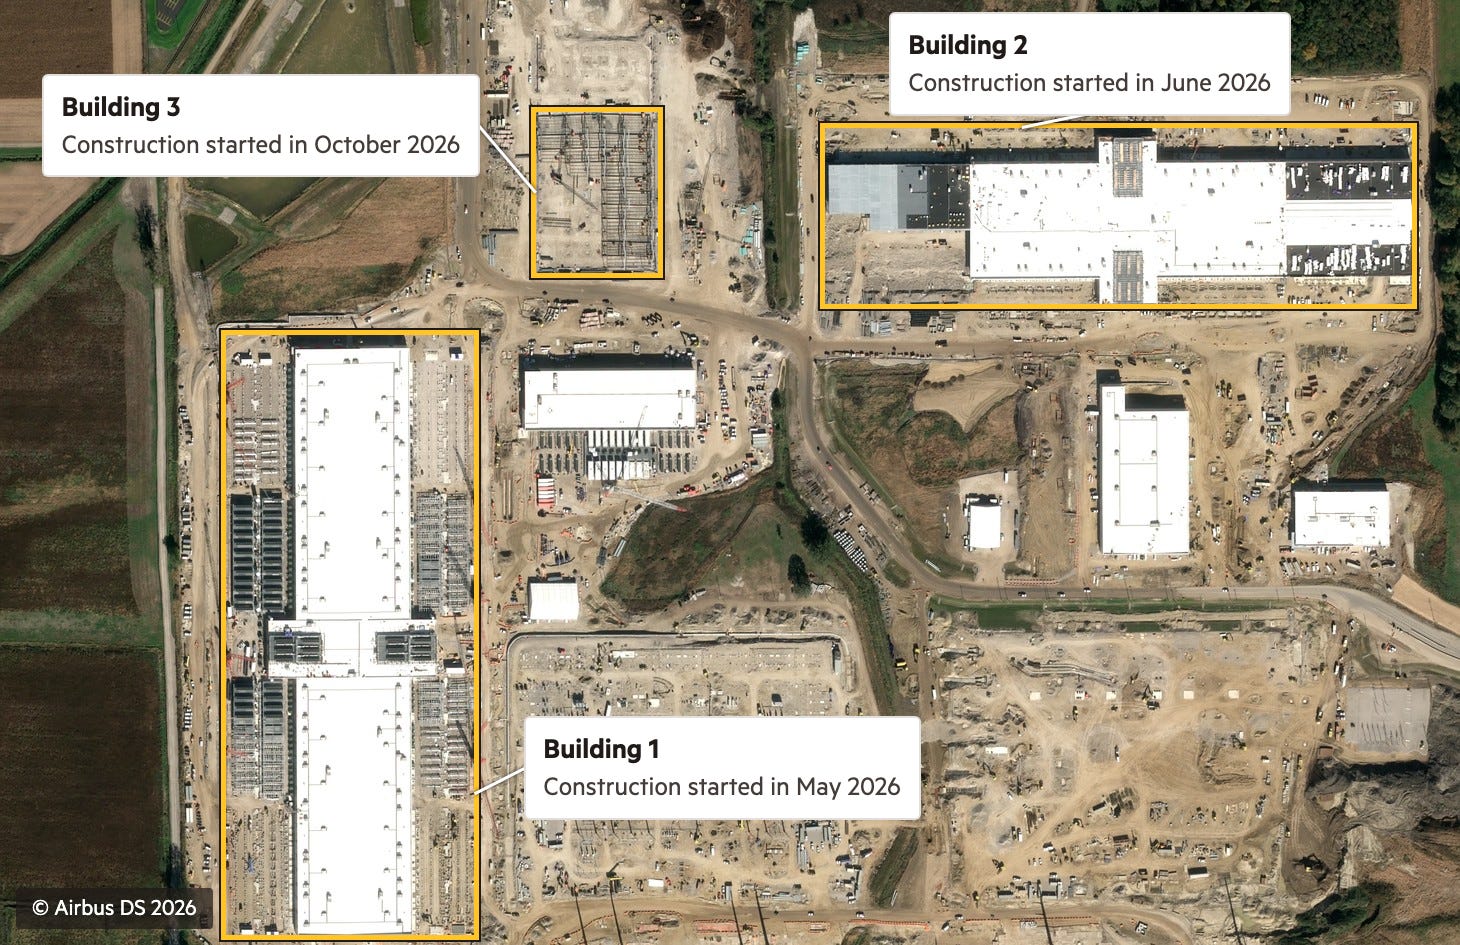
Here’s what that looks like at Stargate Michigan. Construction started on the first building in May, the second in June and the third in October.
For each data center building, we now show:
Construction start: the month vertical construction began, meaning the foundation and steel, not land clearing
History back to 2017: more than 1,300 buildings so far, including nearly every building under construction today
Monthly updates: new starts added as new satellite imagery comes in
All of this data is available in our data platform, CSV exports, and API.
Connect with us to learn more
If you’re a Cleanview customer, construction start dates are live now in the data center table. If you’d like to learn more about our Data Center Tracker and API, send us a note.


Starts can slow, but on PJM (the grid for all or parts of 13 states and DC) power bills are already priced for demand that hasn't arrived. More than three quarters of the 21,470 megawatts of data center demand in PJM's forecast is growth still to come, and PJM's market monitor puts $12.8 billion of data center cost in capacity charges set for June 2027 to May 2029. Does your dataset show how much of the Q3 dip was in PJM states?