
Cleanview November 2025 Power Market Report
Insights from our latest report: Solar's growth is stalling, batteries are booming, and wind is slowing coming back

Each month we track thousands of clean energy projects under development across the United States. Today we published our November 2025 Power Market Report with 35 pages of insights on what we’re seeing across these projects.
In this report, you can find:
What kind of power projects America has built over the last 12 months
What kind of power projects are under construction today
Maps and tables of recently built projects
Maps and tables of projects under construction
Top developers by technology
To access the report, you can sign up for Cleanview by clicking the button below. We’re making the report available to all customers—including those on our 7-day free trial. Customers can find the report by navigating to the Reports tab in our menu.
Takeaways from our report
Solar’s growth appears to be slowing
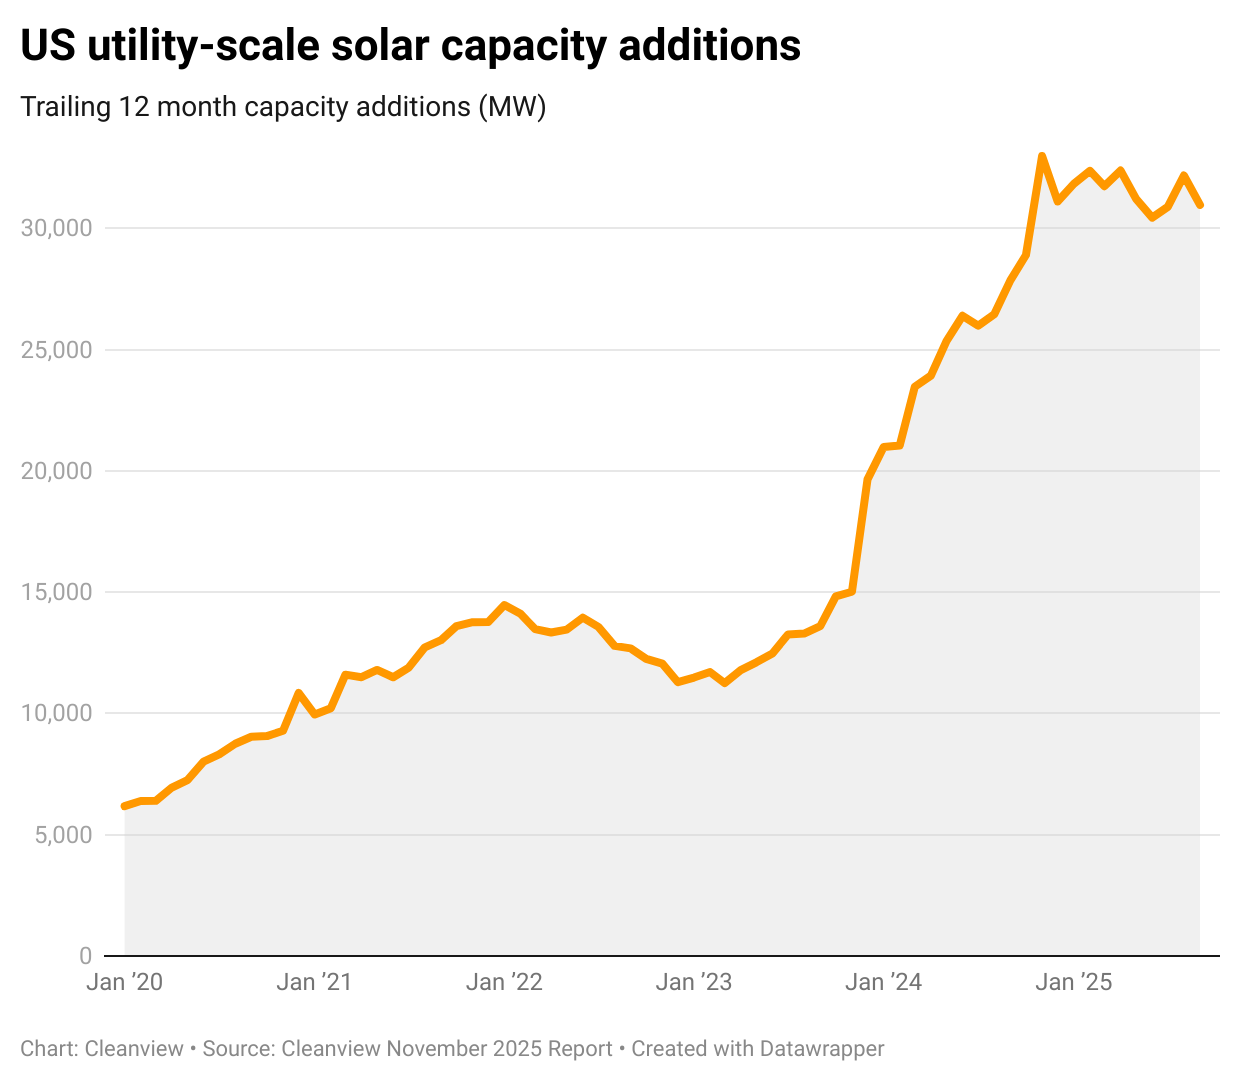
Since the passage of the Inflation Reduction Act in 2022, utility-scale solar has surged. But that growth quietly stalled out beginning in November 2024.
After years of double digit growth rates, annualized utility-scale solar capacity additions have actually fallen by 6% since the end of 2024, dropping from a peak of 32,982 MW in November 2024 to 30,965 MW over the last 12 months.
This is likely due to two reasons. First, solar developers rushed to complete projects before the Biden administration’s tariffs on Southeast Asian imports kicked in. This pulled forward many projects that otherwise would have been built this year. Second, high interest rates have probably cut some of the appetite from investors considering their impact on returns.
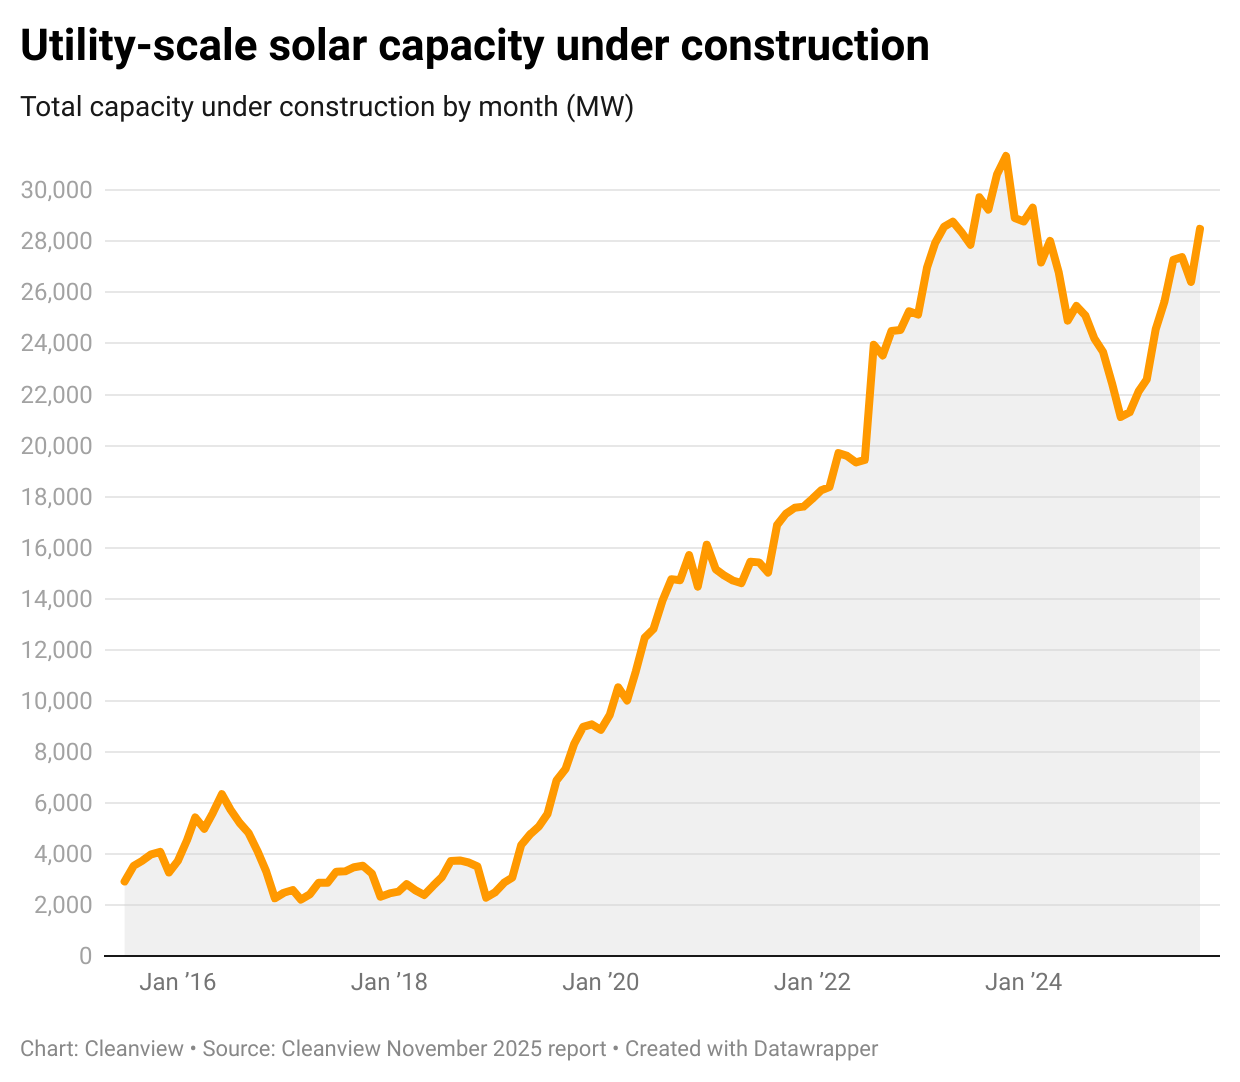
This trend may be changing soon, according to construction pipeline data. After falling between November 2023 and November 2024, the amount of solar capacity under construction has been rising quickly over the last year.
Solar construction pipeline should grow in the years ahead as developers race to bring projects online before the expiration of the ITC tax credit.
The battery market continues to boom
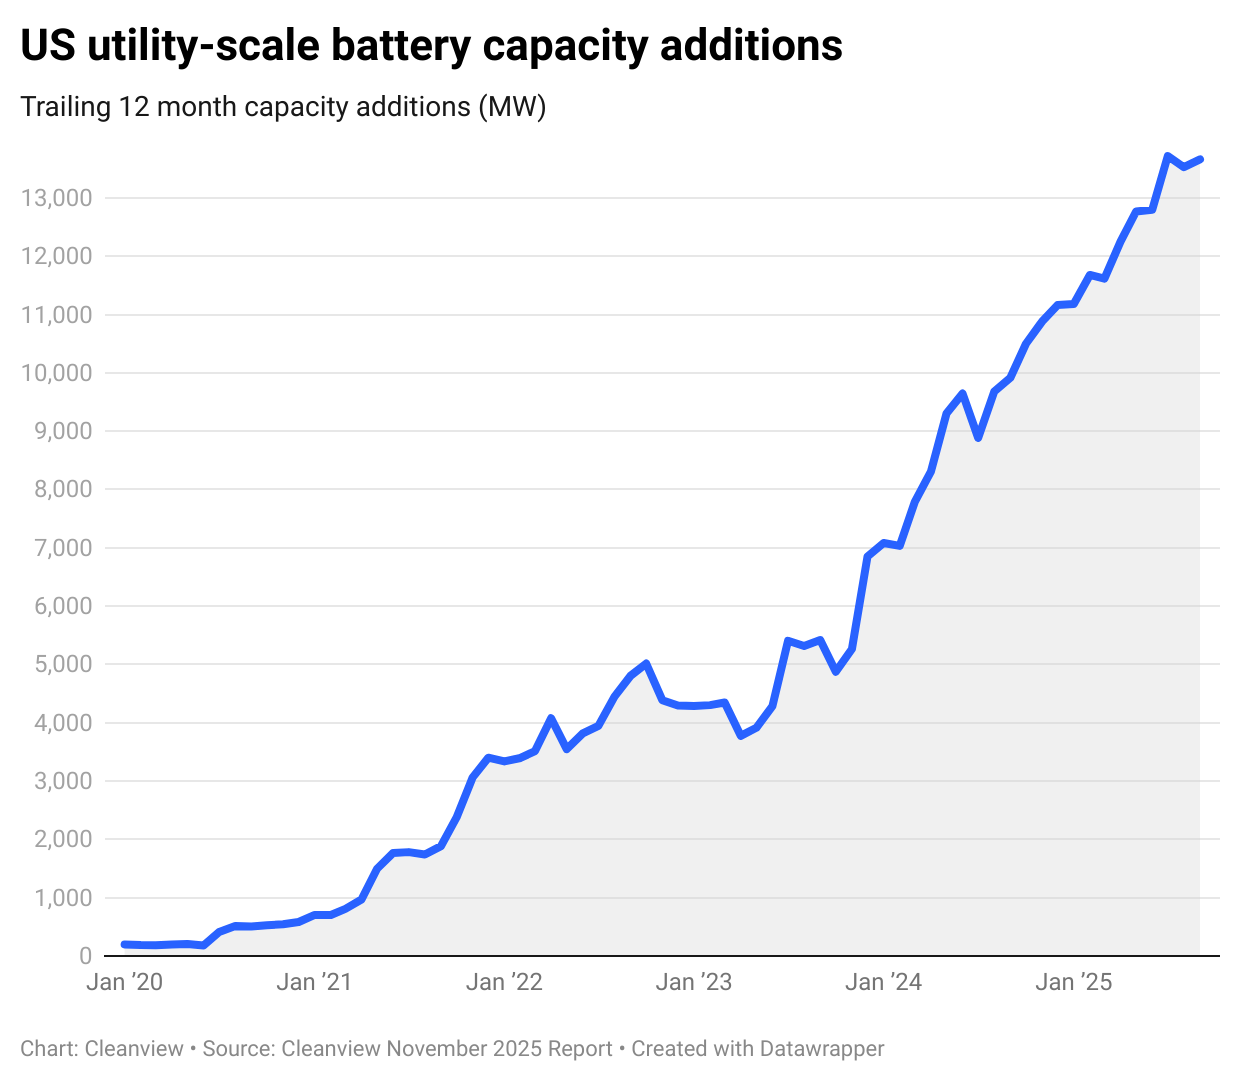
Battery storage hasn’t seen the same slowdown that solar has. Instead, annualized battery capacity additions have grown by 284% in the last three years and 38% in the last year alone, reaching 13,661 MW over the trailing 12 months.
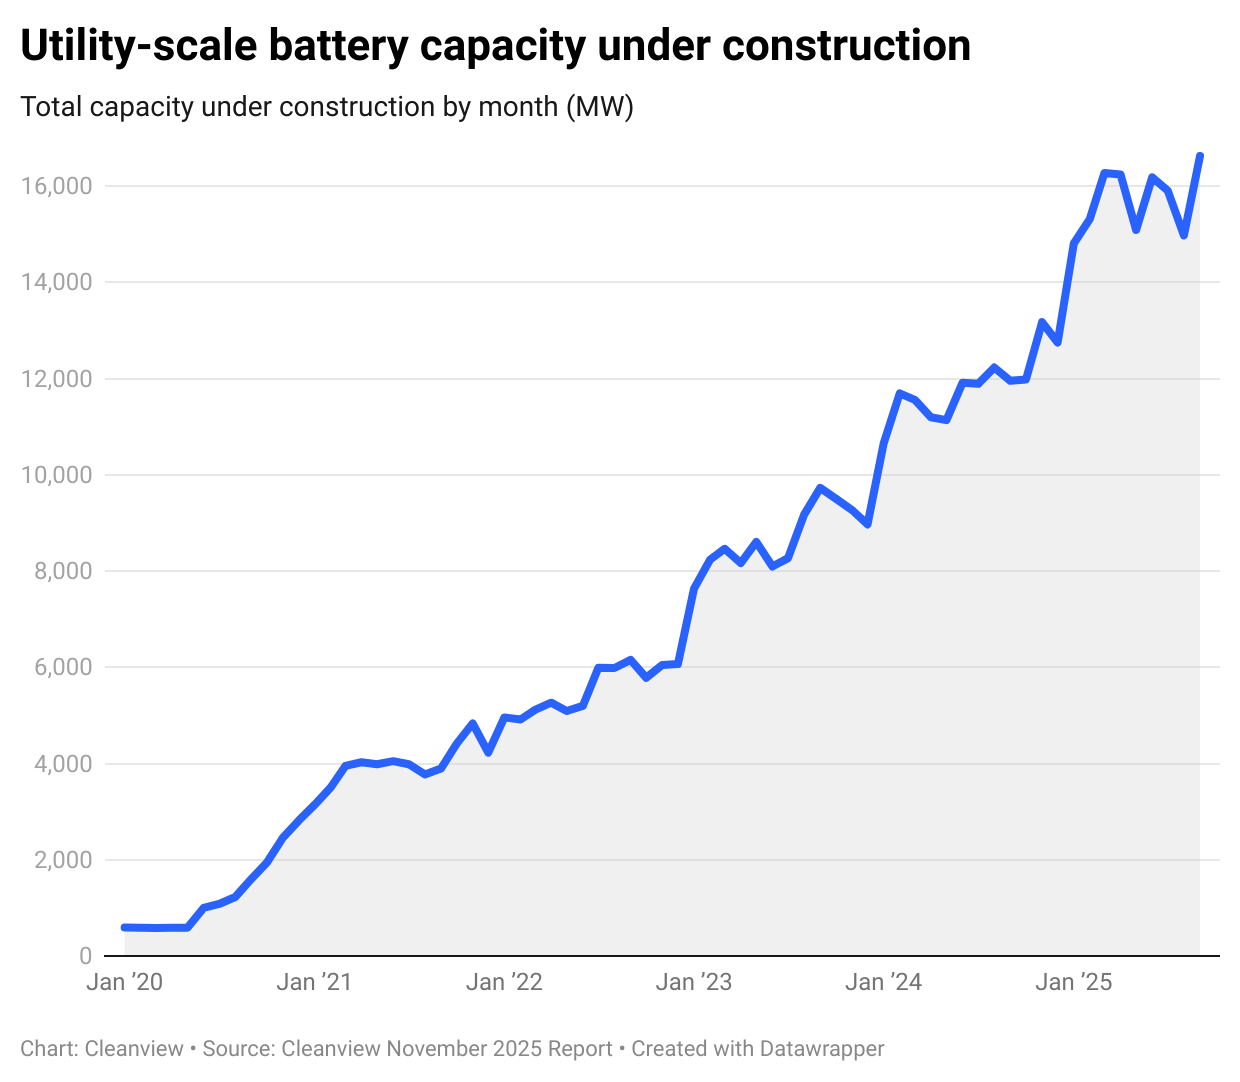
But here, too, things could be changing in the near future. Battery construction pipeline reached 16,626 MW as of September 2025—up 39% year-over-year—but has been relatively flat since March 2025.
This could be due to unprecedented uncertainty in tariff rates—which impact virtually all battery projects. It could also be due to the record-low battery revenues that investors are seeing in Texas—the country’s largest battery market in the country.
Wind power continues to struggle
The wind industry continues to struggle in the US. Wind capacity additions have fallen by 74% since their October 2021 peak, when the country added 18,526 MW. Over the last 12 months, the US added just 4,792 MW of new wind capacity—a 29% decline compared to September 2024.
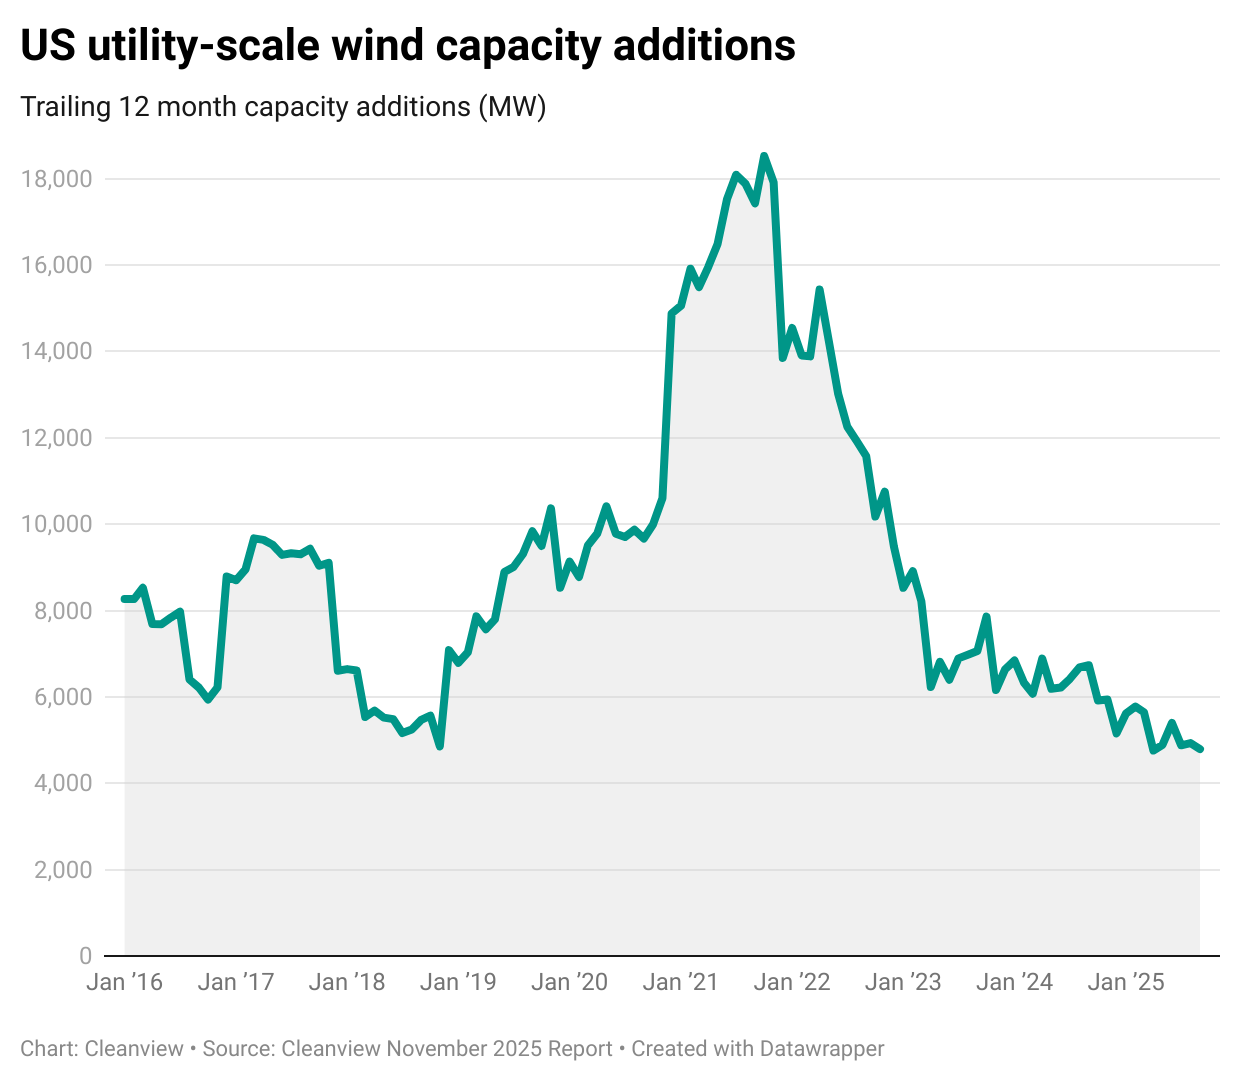
This decline reflects ongoing challenges including supply chain constraints, permitting issues, interconnection costs, rising input costs, and high interest rates. Unlike solar, which saw a post-IRA boom, wind has yet to experience a meaningful recovery.
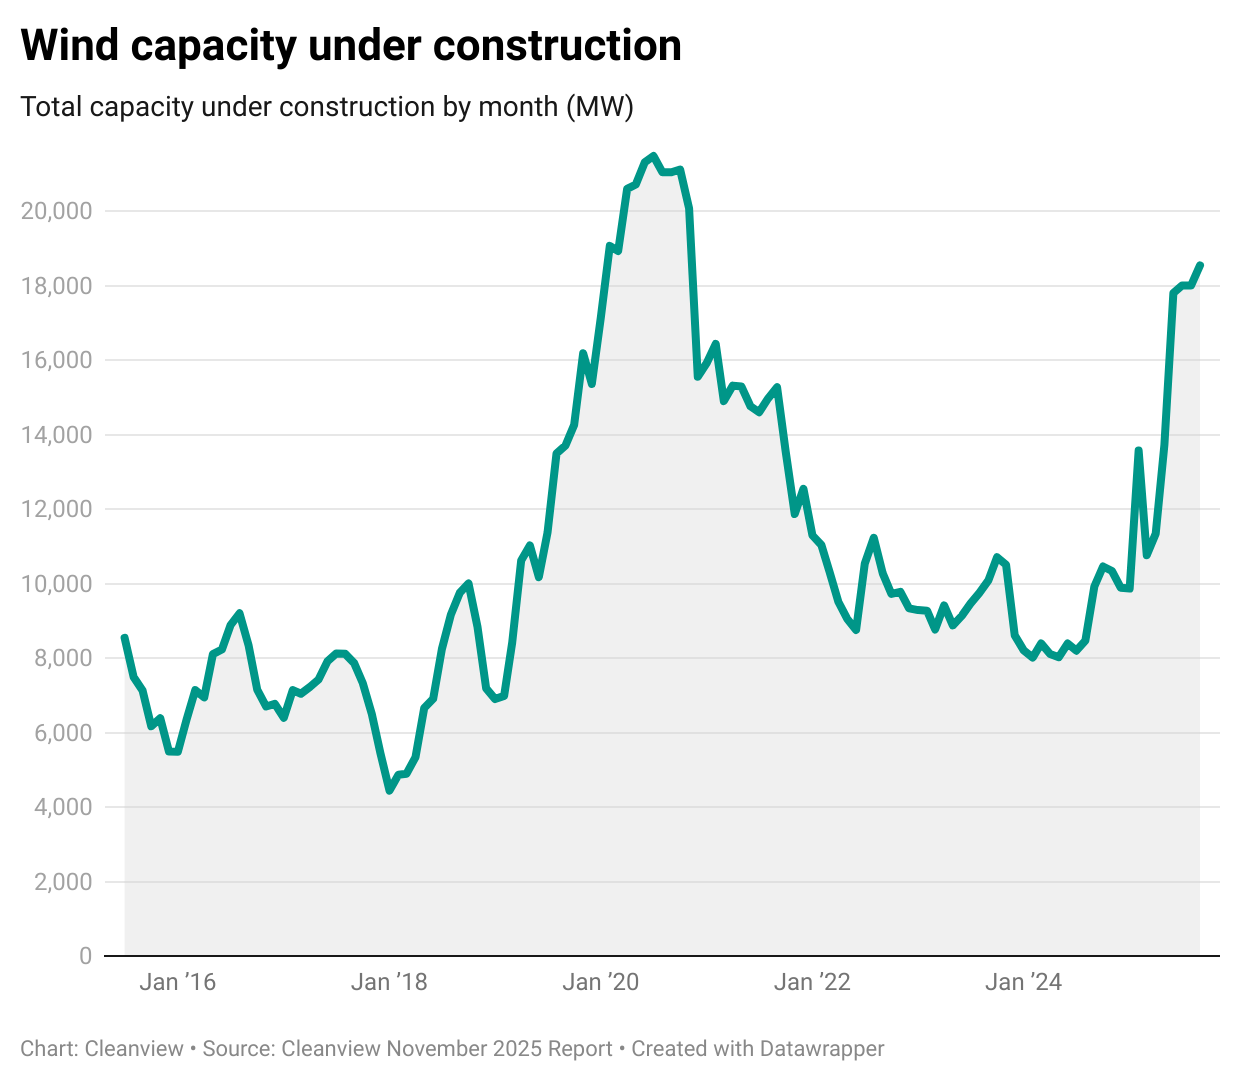
However, there are some signs of potential improvement. Wind capacity under construction has grown by 87% year-over-year to reach 18,543 MW as of September 2025. This has been driven primarily by mega-scale projects that have been in the works for years and are finally reaching construction.
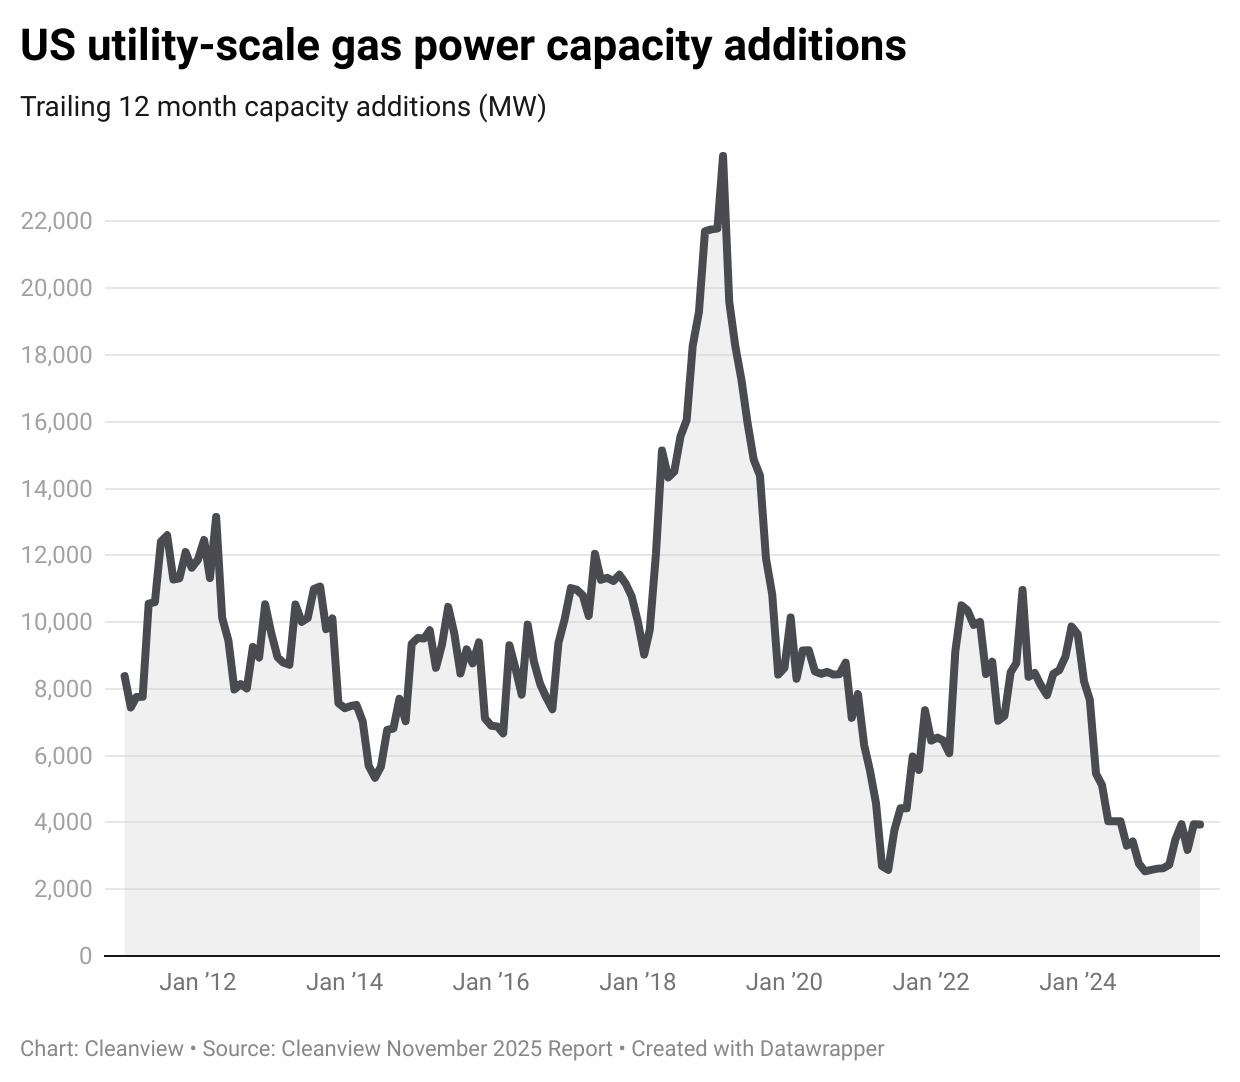
Gas power is coming back—slowly
Natural gas capacity additions have shown modest recovery, growing 19% year-over-year to reach 3,937 MW over the last 12 months. However, this remains 84% below the March 2019 peak of 23,959 MW, reflecting the long-term decline of new gas plant construction.
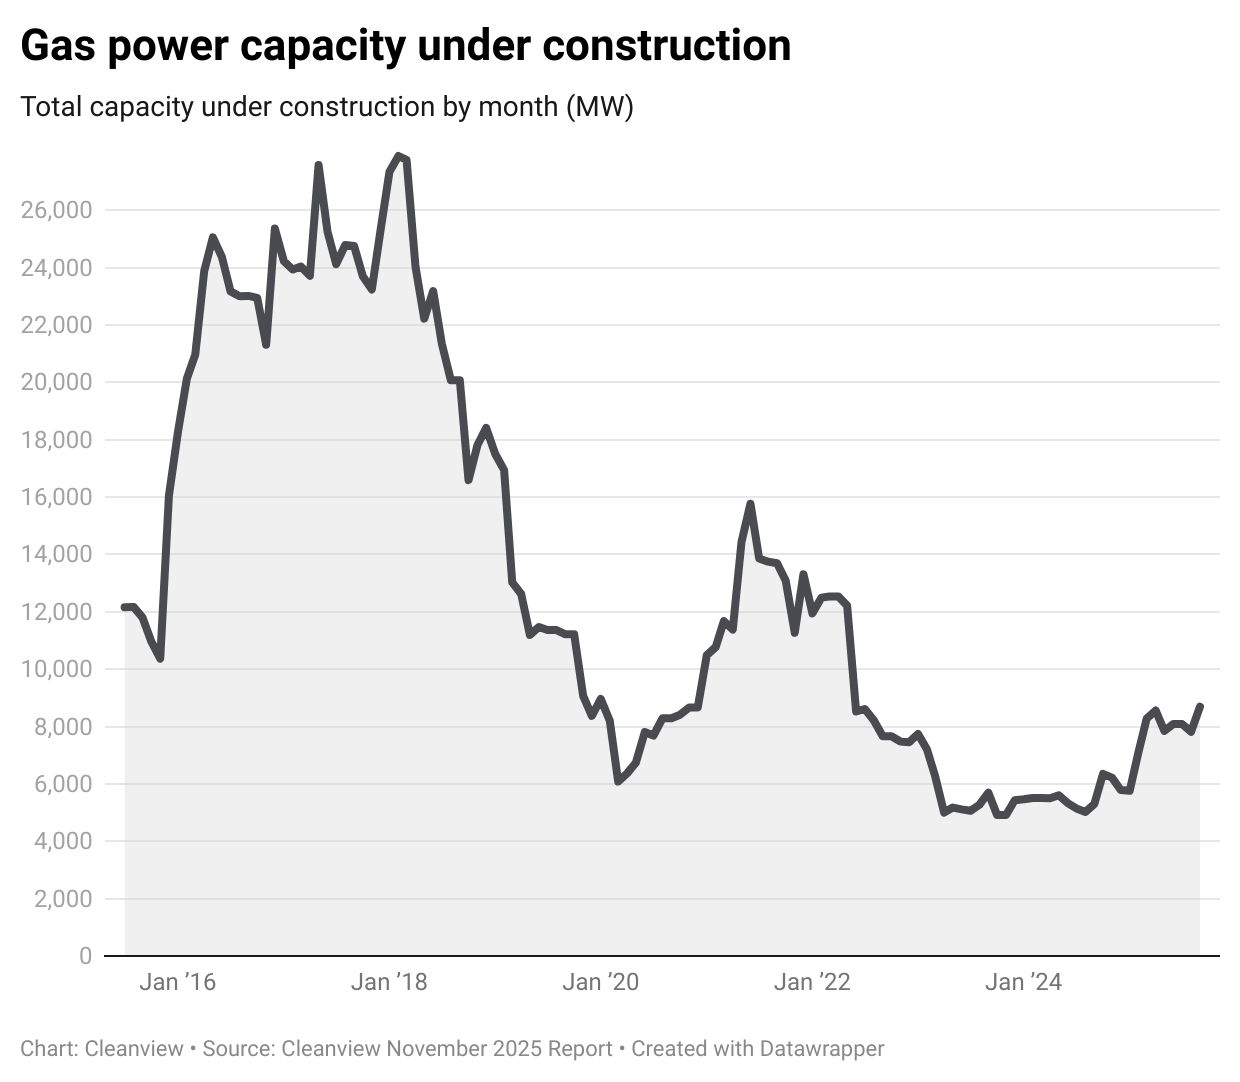
The construction pipeline tells a more interesting story. Gas capacity under construction has grown 64% year-over-year to 8,691 MW. Meanwhile, gas capacity across all stages of development we track has more than doubled in the last year.
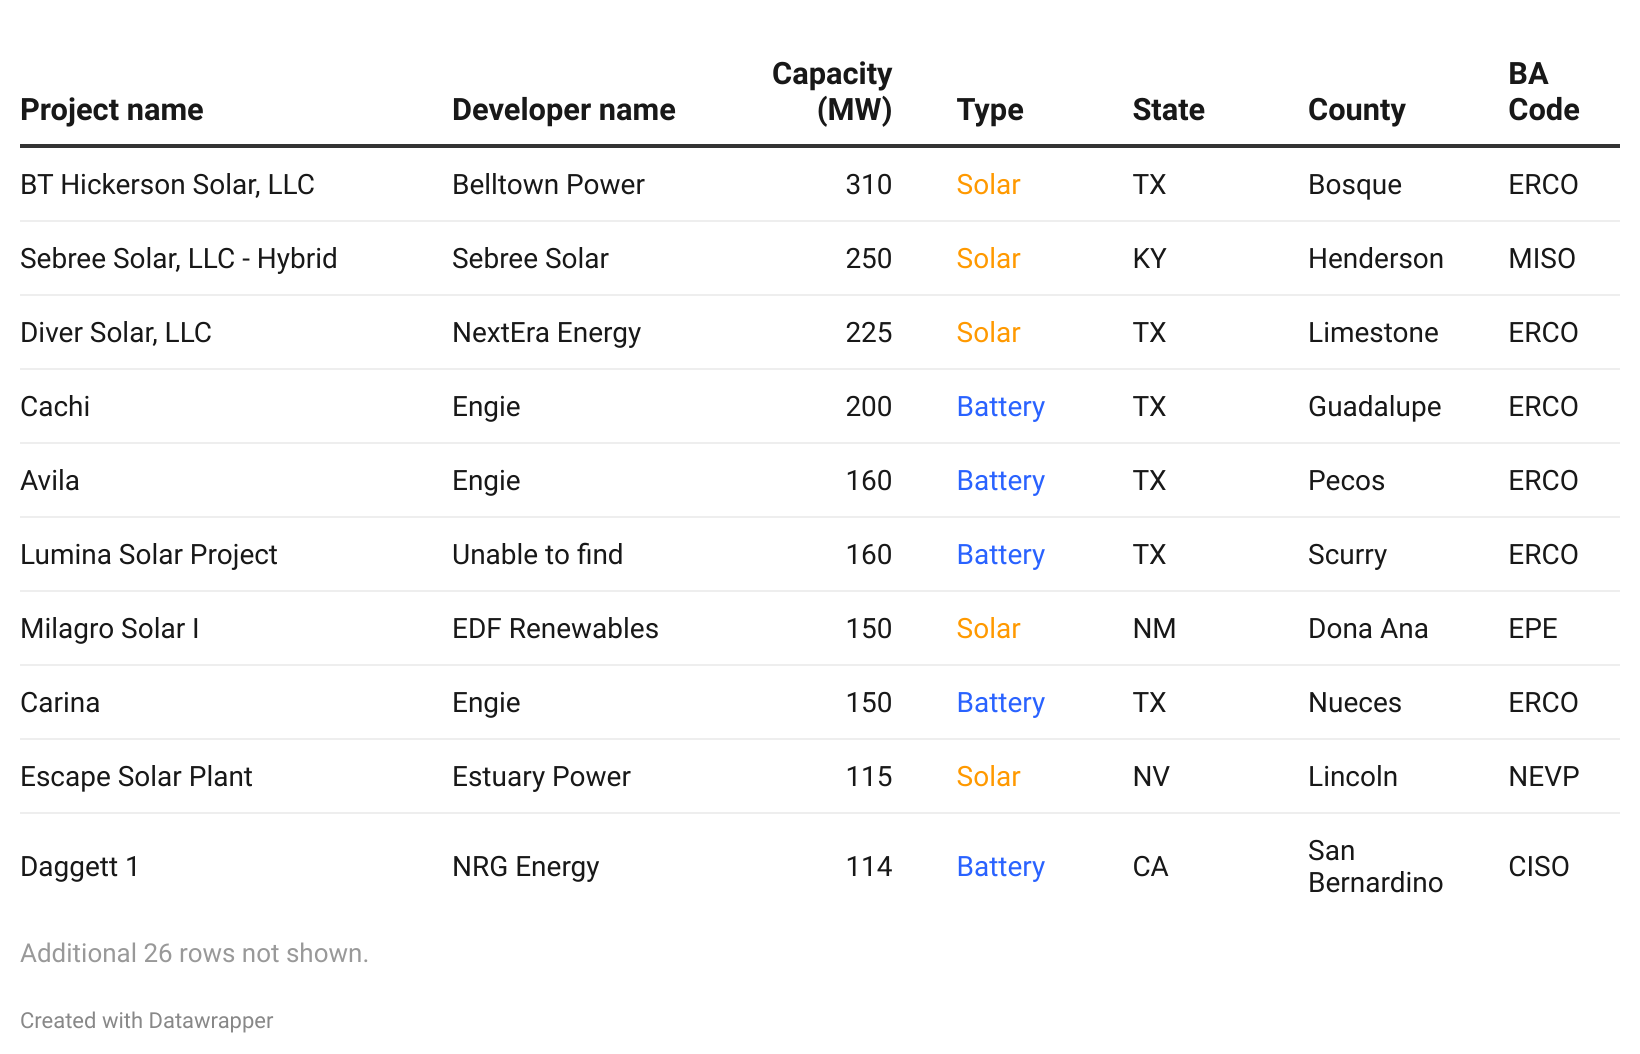
Recently built projects
In the report, you can also see recently built projects across different technologies. Here are the largest power projects that came online over the last month:
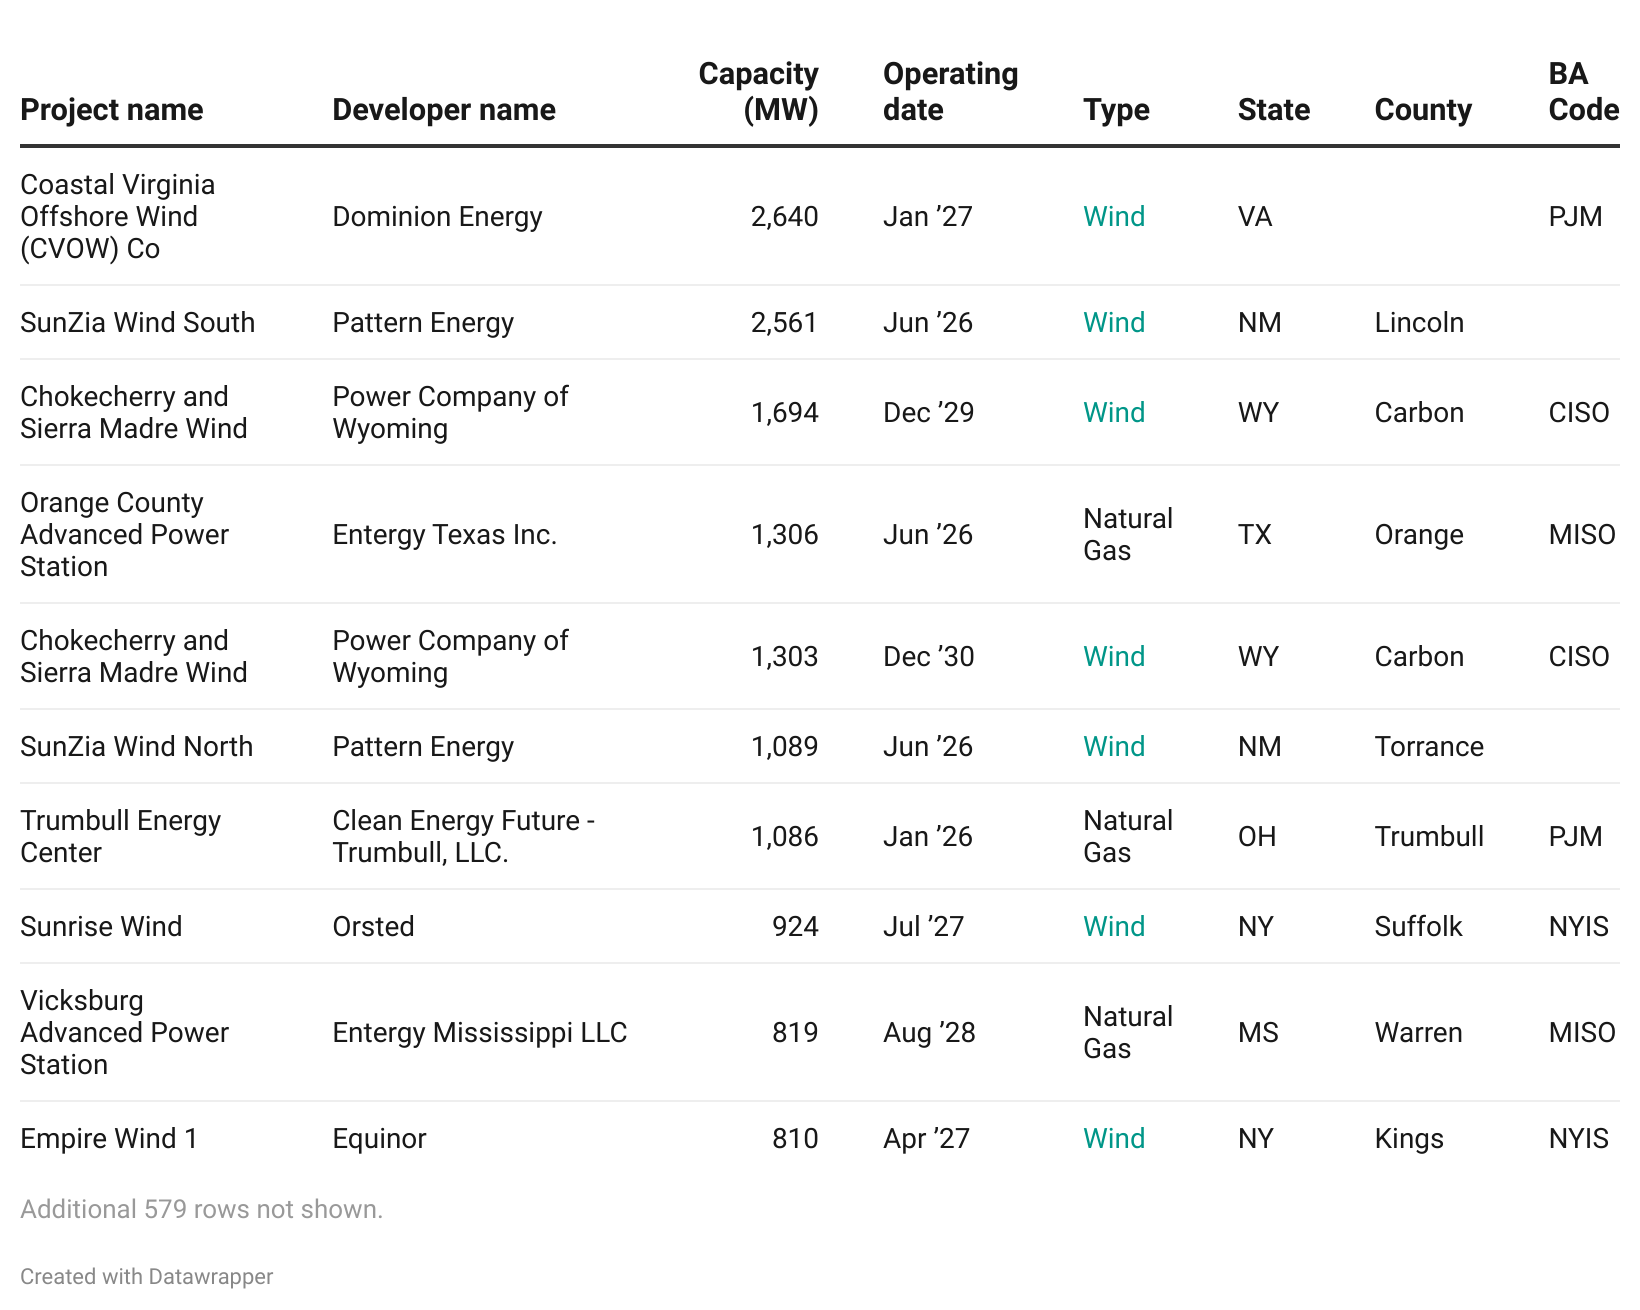
Projects under construction
The report also features power projects under construction by technology. Here are some of the largest power projects under construction in the US:
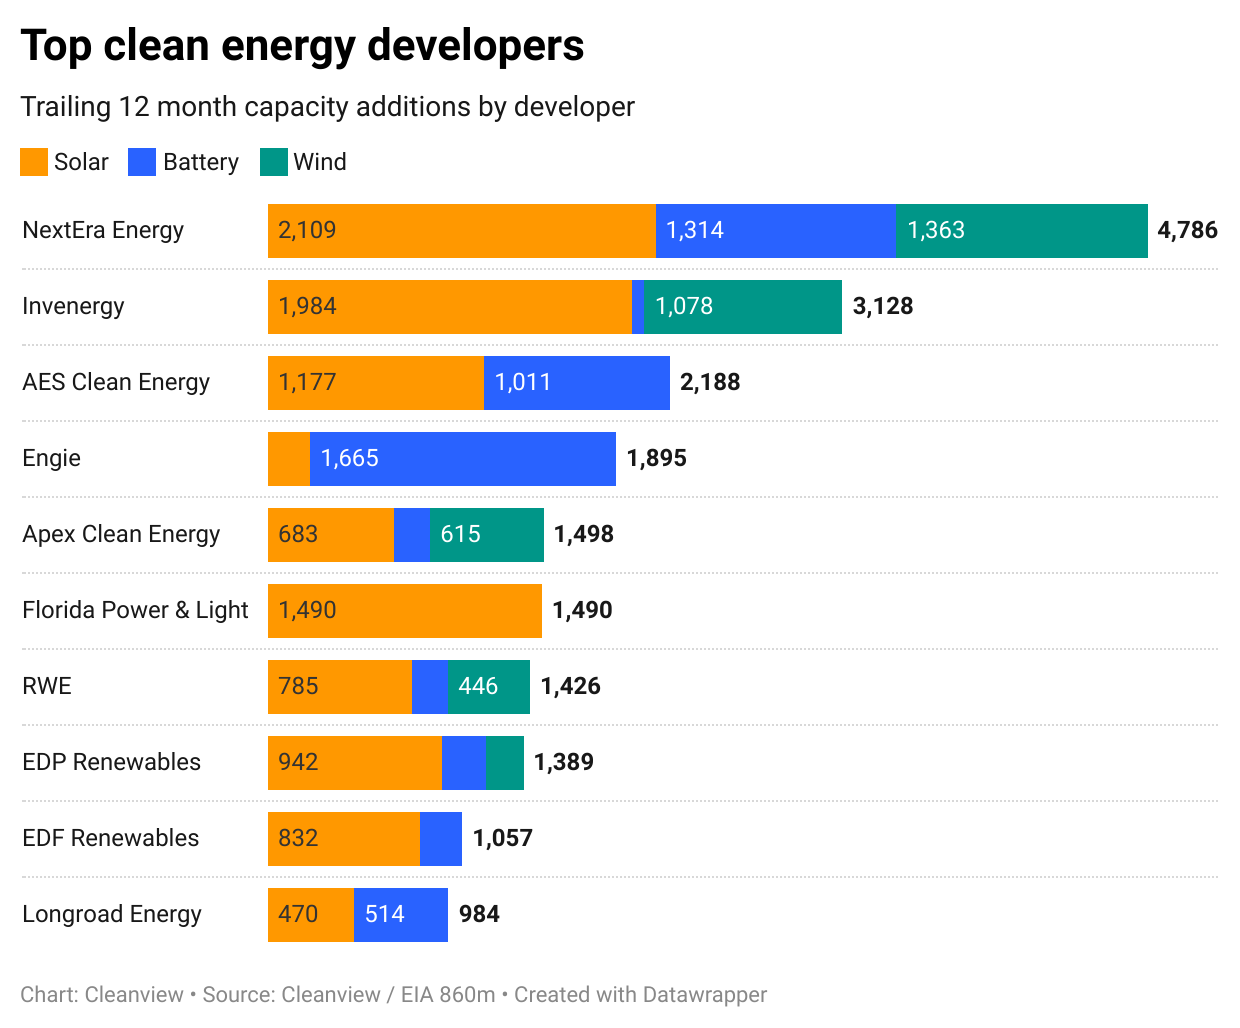
Top developers
Using our developer benchmark tool, we’ve ranked the top developers in the US across each technology. Here’s a summary for all clean energy technologies:
Get the full report
To access the report, you can sign up for Cleanview by clicking the button below. We’re making the report available to all customers—including those on our 7-day free trial.


Great breakdown. What stands out is how load growth from AI and data centers is beginning to overpower traditional seasonal patterns. The next phase of grid planning is going to be defined by baseload certainty — and that’s exactly where advanced nuclear and long-duration assets become unavoidable.