
Clean energy's boom and perilous moment
50 clean energy trends from the last year and a new report

Over the last few months, I've been analyzing data on clean energy trends in America to understand the current state of progress. Today I'm excited to share the results in Cleanview’s first annual State of Clean Energy Deployment report.
The full report is packed with trends, data, and stories. Here’s some of what it covers:
How much solar, wind, and battery storage capacity the U.S. and each state built in 2024
Which states and grids saw the fastest growth in 2024
Maps of where clean energy projects were built in the U.S. (Spoiler alert: They were built all over)
The largest projects built in 2024
Which developers built the most solar, wind, and battery storage capacity in 2024
How much clean energy developers expect to build in 2025
Our report is the first to show these figures for 2024 given the federal data that it is based on was released just a few weeks ago. For that reason, the report has already been covered by The Guardian, Canary Media, and a few other publications.
You can read the full report by clicking the button below.
Over the next few weeks I’ll share some of the takeaways that piqued my interest the most in doing this research, as well as additional commentary and analysis that didn’t make the final version.
So with that, let’s get into some clean energy trends.
Another record breaking year for clean energy
The U.S. added 48.2 gigawatts (GW) of utility-scale solar, wind, and battery storage capacity in 2024 – a staggering 47% increase compared to 2023’s record year.

While the scale of clean energy’s growth in 2024 was remarkable, the fact that clean capacity grew probably won’t surprise readers of this newsletter. At least, it didn’t surprise me. What was shocking to me, however, was just how much of the new power capacity that came online in 2024 was clean.
95% of all new power capacity added to the grid in 2024 was carbon-free. Solar and batteries alone accounted for 83% of new capacity additions. The U.S. even added some nuclear capacity after more than a decade of no growth from that carbon-free technology.

Natural gas—the fossil fuel of choice for utilities and power producers throughout much of the 21st century—contributed little to new grid capacity. In fact, new gas power plant additions reached their lowest point since the 1990s.
The era of the clean energy megaproject
One of the many reasons for the growth of clean energy was the rise of the megaproject. As I wrote recently:
In 2014, the average solar farm built in the U.S. had a capacity of 10 megawatts (MW)—big enough to power a few thousand homes. By comparison, the average solar farm built in 2024 had a capacity of 65 MW, six times larger than the typical project built a decade ago.
Last year, developers built 135 solar, wind and storage projects with 100 MW or more of capacity. The largest project—Gemini Solar Hybrid—was 4.5 times larger than the largest project built a decade ago.

In Texas alone, developers built 55 projects with 100 MW of capacity or more. But megaproject growth wasn’t limited to the Lone Star state. Developers built 100+ MW projects in 24 different states, everywhere from Montana to Alabama.

I find the clean energy megaproject trend endlessly fascinating. It is a rebuttal to the cliche we hear so much that America can no longer build big infrastructure projects. It’s driving the cost of clean energy further downward thanks to economies of scale. And it is also, no doubt, one of the reasons for the growth of NIMBYism and local opposition to clean energy.
Solar shined bright last year
In 2024, the star of the clean energy show was without a doubt solar energy. The U.S. added 32.1 GW of new utility-scale solar capacity in 2024. Annual solar capacity additions rose by 65% in 2024 compared to 2023 when the country added 19.5 GW.
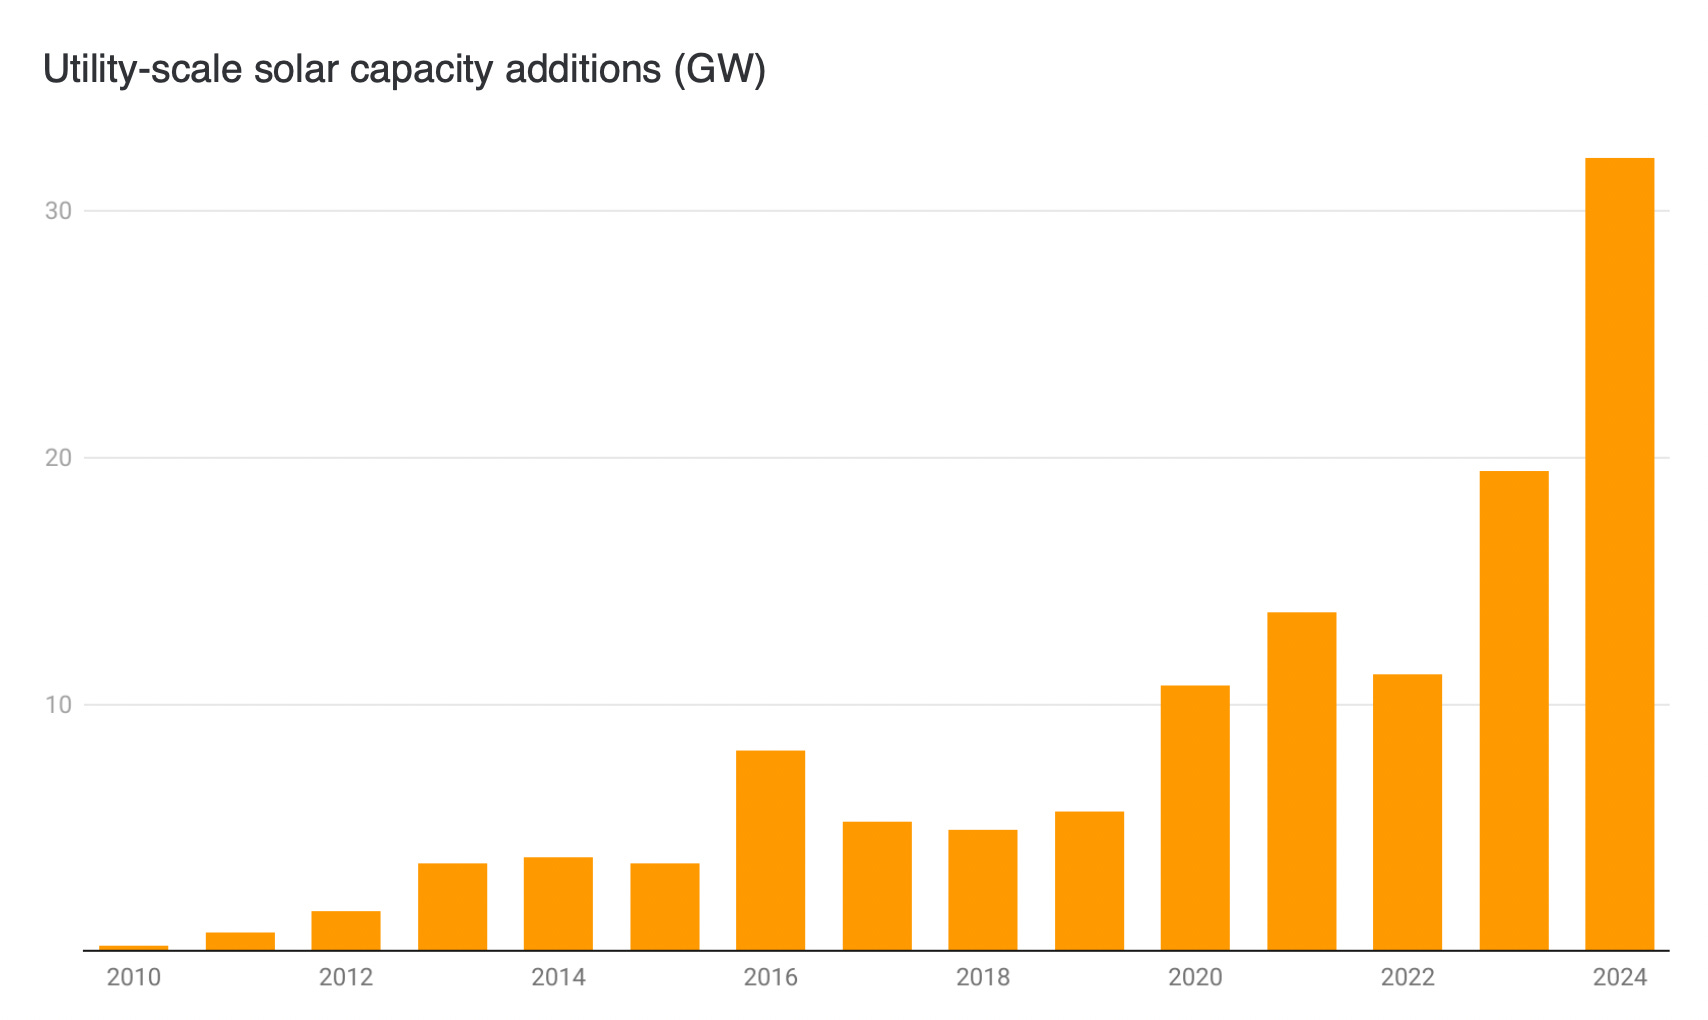
Few states were untouched by this solar boom. As the map below shows, developers built utility-scale solar projects in 45 different states, everywhere from Florida to Maine to Hawaii.

But solar’s growth was far from evenly distributed. Texas added the most capacity, bringing 8.9 GW of new capacity online. Florida added the second most capacity (~3 GW). The Sunshine State added more solar capacity than California (2.5 GW) for the first time.
New Mexico, Illinois, and Georgia all saw explosive growth, more than doubling the amount of solar capacity additions compared to 2023.

Solar also started to boom in the sunny South in states that have, up until now, been slow to adopt the technology. Arkansas, Missouri, and Louisiana all saw solar surge in 2024.
It’s worth noting that these are all deep red states.

The trillion dollar question
The most important driver of the growth in clean energy has been the Inflation Reduction Act that former President Biden and Democrats passed in 2022.
The bill extended the investment and production tax credits (ITC and PTC). These tax credits—and the adders for using materials made in the U.S. and building in “energy communities”—can cover up to 50% of the cost of a new clean energy project.
But, as you may have heard, a new President and Congress took power this year. President Trump has called wind energy “garbage.” He immediately began passing executive orders trying to curb clean energy’s growth. Republicans have already introduced bills into Congress aimed at boosting fossil fuels at clean energy’s expense.
These orders will impact some projects more than others. Offshore wind projects like Vineyard Wind I and Revolution Wind—which will add a combined 1.5 GW of new clean energy capacity later this year—are already permitted and under construction. The administration can no doubt find ways to slow these projects down on the margins. But they’ll almost certainly reach final completion.
There are hundreds of other solar, wind, and battery projects that are already permitted and under construction across the country. According to Cleanview’s project tracker, more than 23 GW of solar, 12 GW of storage, and 6 GW of wind capacity is already well underway.
2025 won’t be the record-shattering year that 2024 was, but clean energy won’t face total collapse either. Far from it in fact.
Developers plan to bring online 60 GW of new clean energy capacity this year. If those numbers hold, that would represent 26% growth compared to 2023’s growth rate of 47%. Surprisingly, much of the growth would come from wind and storage, not solar.
I’ll again emphasize that many of these projects are already permitted and under construction, protecting them from the worst of Trump’s early policies and orders.

Beyond 2025, there is much uncertainty about clean energy’s future in the United States. The question on everyone’s mind is how much Trump and Republicans in Congress will slow or reverse the growth of clean energy. This is what I’ve begun to refer to as the trillion dollar question.
No one can answer this question with certainty. But I think we can expect one of two scenarios to play out.
Two very different paths forward for clean energy
The first scenario is what I’ll call the “Good news scenario.” In this scenario, Trump, Congressional Republicans, and Energy Secretary Chris Wright talk a big game about promoting fossil fuels and curbing renewables, but they don’t take any catastrophic legislative action. Maybe they try to gut the IRA and its tax credits, but they face a similar resistance to what we saw when Trump tried to repeal Obamacare.
In this scenario renewables continue to grow just like they did under the first Trump presidency. It’s easy to forget, but solar capacity more than doubled during Trump’s first term because costs fell and Congress kept the investment tax credit.
The second scenario is what I’ll call the “Bad news scenario.” And make no mistake, it could be really bad. In this scenario, Trump, Congress, and the Department of Energy, do everything they can to curb the growth of renewables. They don’t just talk the talk, as they have in recent weeks, and bash renewables from the Bully Pulpit; they walk the walk too.
Legislatively, Trump and Congress could repeal the IRA outright and gut its tax credits, including the ITC and PTC. They could gut the clean energy manufacturing incentives that encourage companies to make solar panels, batteries, and wind turbines in the U.S. and at the same time keep Biden’s solar and battery tariffs in place effectively squeezing prices higher and reversing the downward cost trends we’ve seen over the last few decades.
With executive authority alone, Trump could make permitting renewable and storage projects a nightmare, as he’s already started to do. That could include projects on federal land, but also those on private land that need to get various approvals for things like wildlife and water impacts.
Repealing the IRA would hurt Republican counties most
The good news is that the vast majority of the projects that are being built and the manufacturing facilities being constructed are in red districts. Clean energy money is flowing to Republican counties across the country. Traditional political economy and theory would tell you it’s going to be unpopular to gut the IRA.
As I wrote last November:
Since 2023, the country has built 56 GW of utility-scale solar, wind and battery capacity, according to data from Cleanview. 36.9 GW (66%) of that capacity has been built in counties that voted for Trump in 2020. By comparison, 19.2 GW (34%) has been built in counties that voted for Biden.

I’m more skeptical of this argument than most of the people I talk to. Nothing about the Trump administration is based on reason. And while this comment will probably get me on some list, I’ll say it anyway: Trump is just not a rational person in the way he does politics. He is chaotic, irrational, and transactional.
I worry about the complacency that I see around the IRA’s repeal and what would happen if it were repealed.
But if past is prologue, then much is still in our collective control. In the 2016 election, Trump promised to gut Obamacare. And he failed because traditional political economy won out. The policy proved popular; people fought to preserve it; and Congress listened to their constituents for fear of being voted out.
The IRA could face a similar rosy fate. But that is only likely if we all fight to make it so.
Read the full report
You can read the full report by clicking the button below. And, if you haven’t done so already, you can subscribe to the Cleanview newsletter to receive more of the major takeaways in your inbox over the next few weeks.


